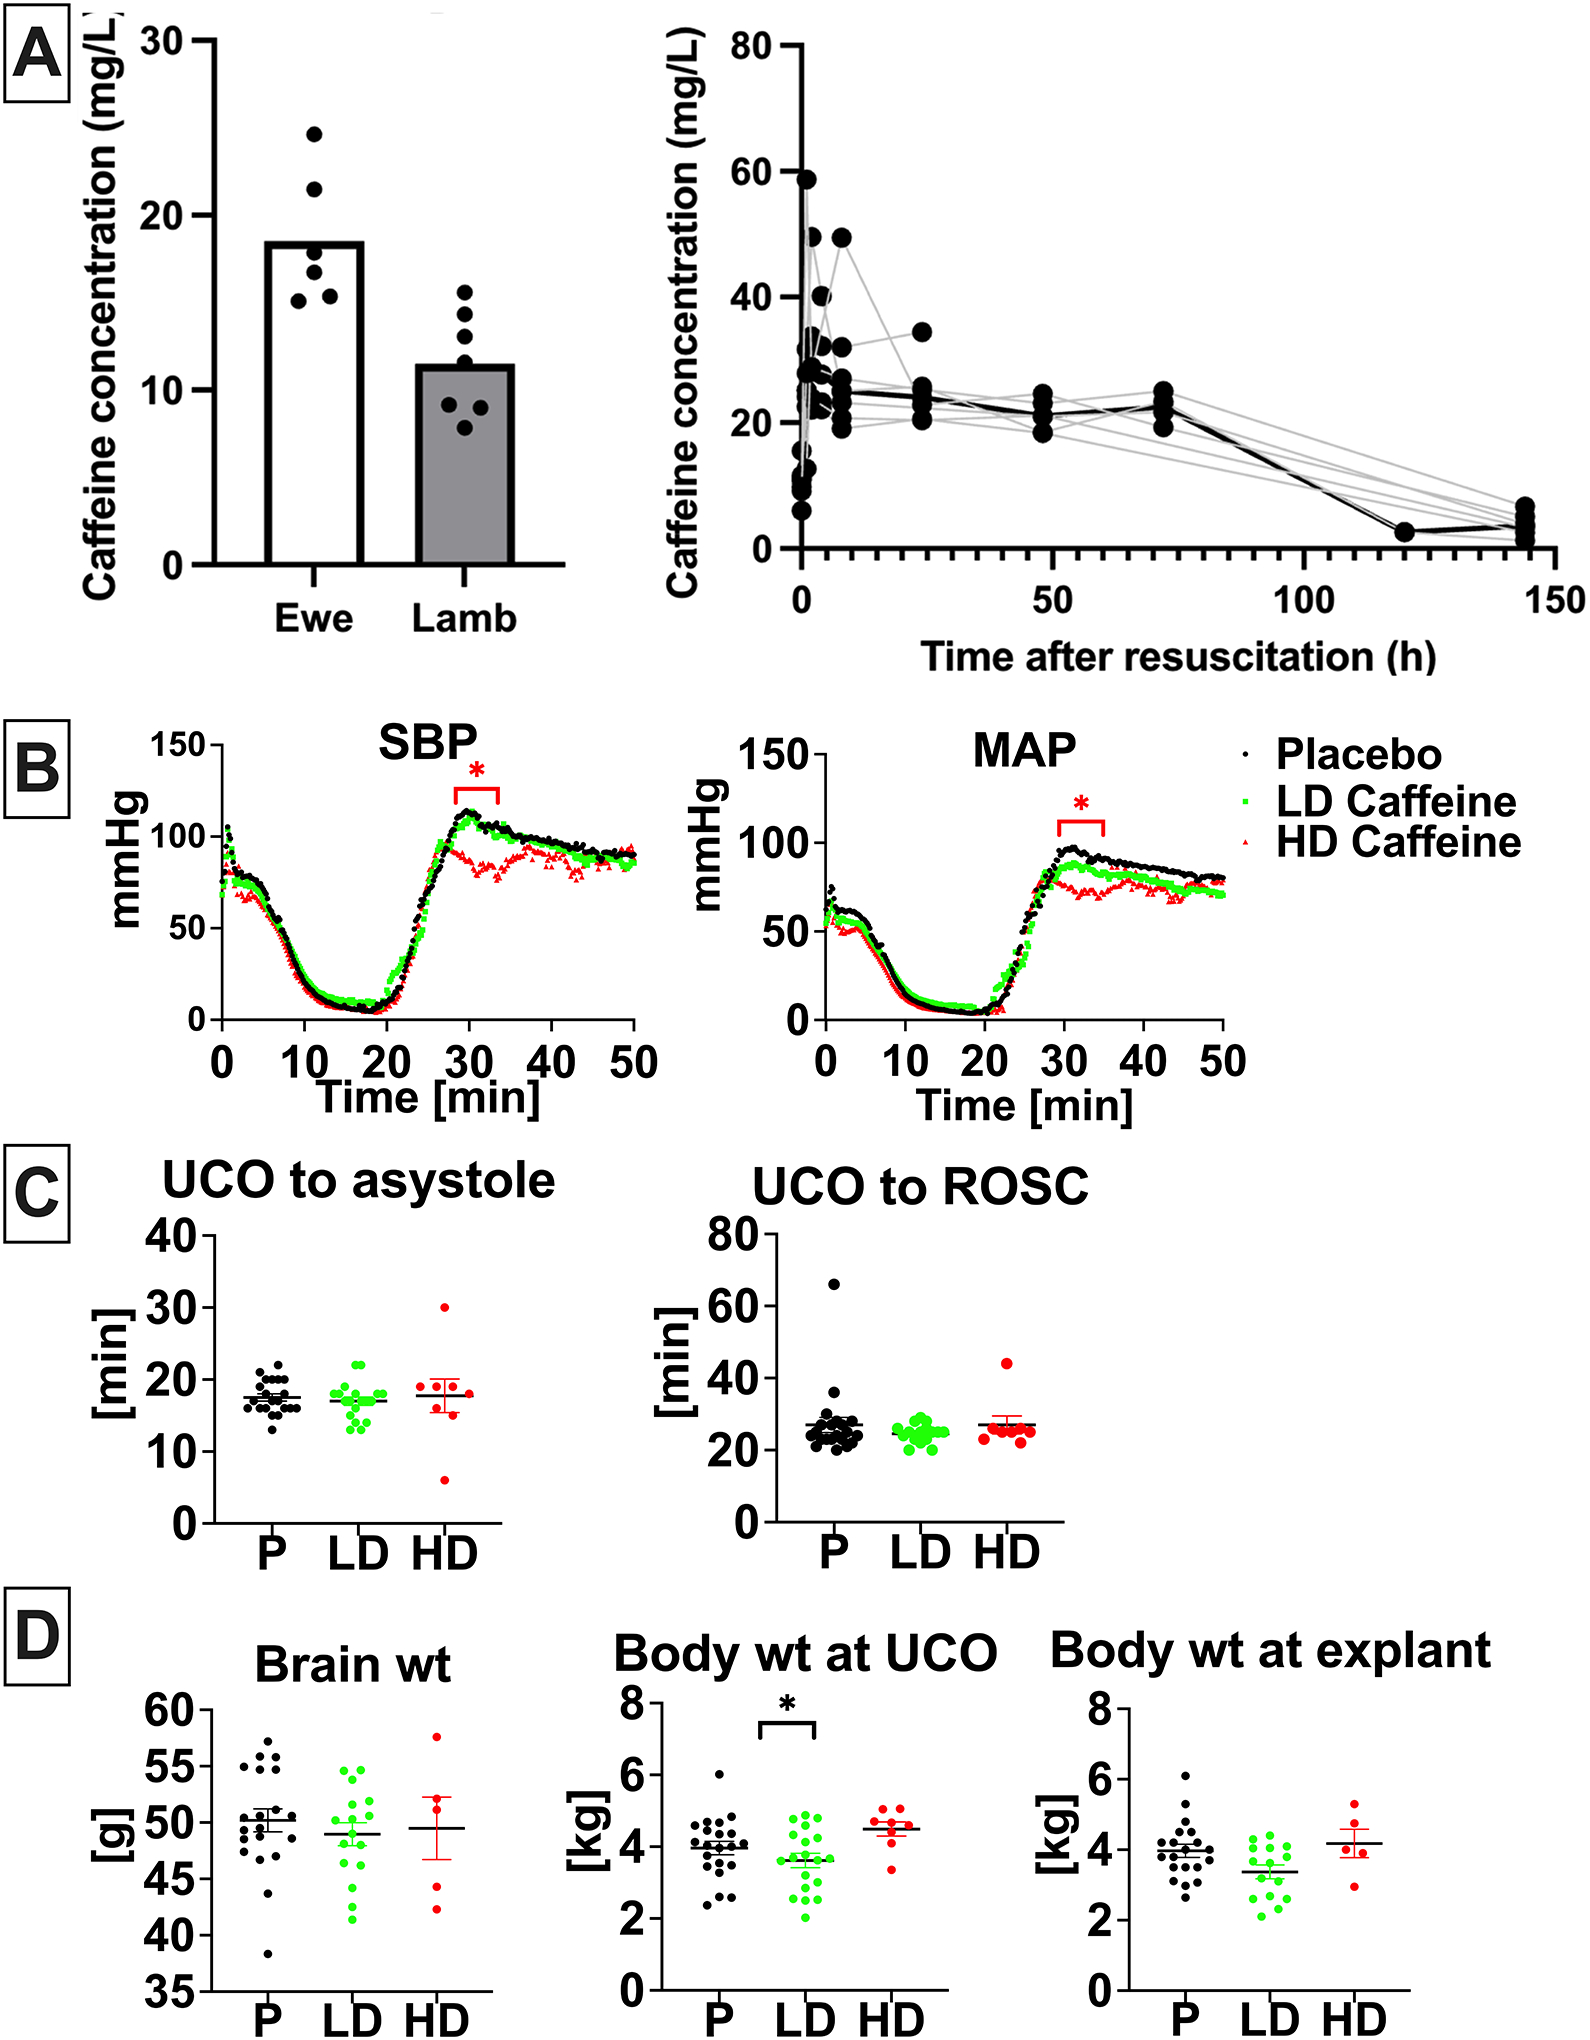
Figure 1. Caffeine PK and effects on resuscitation.

A, Caffeine concentration in ewe (n=6) and lamb (n=7) plasma at the time of umbilical cord occlusion and caffeine concentration in lamb (n=7) plasma over time. B, Hemodynamic changes in response to UCO with drop in SBP and MAP followed by increase reflecting ROSC. Hemodynamic data was analyzed using grouped analysis of the individual group’s means for a specific time point. Placebo- n=19, LD-caffeine, n=14, HD-caffeine, n=7. C, Time to asystole and time to ROSC was similar among compared groups. Groups were compared using Kruskal-Wallis test. Placebo- n=21, LD-caffeine, n=18–19, HD-caffeine, n=8. D, Selected anthropometric parameters between the studied groups. Brain and body weight differences were assessed using ANOVA. Data shown in the graph B are shown as mean, graph C and D as mean ± SEM, graph. Placebo- n=20–21, LD-caffeine, n=16–19, HD-caffeine, n=5–8. UCO-umbilical cord occlusion, ROSC-return of spontaneous circulation, SBP-systolic blood pressure, MAP-mean arterial pressure, wt- weight,; LD-caffeine-treated group, green, HD-caffeine treated group- red, Placebo- black. *p<0.05.
