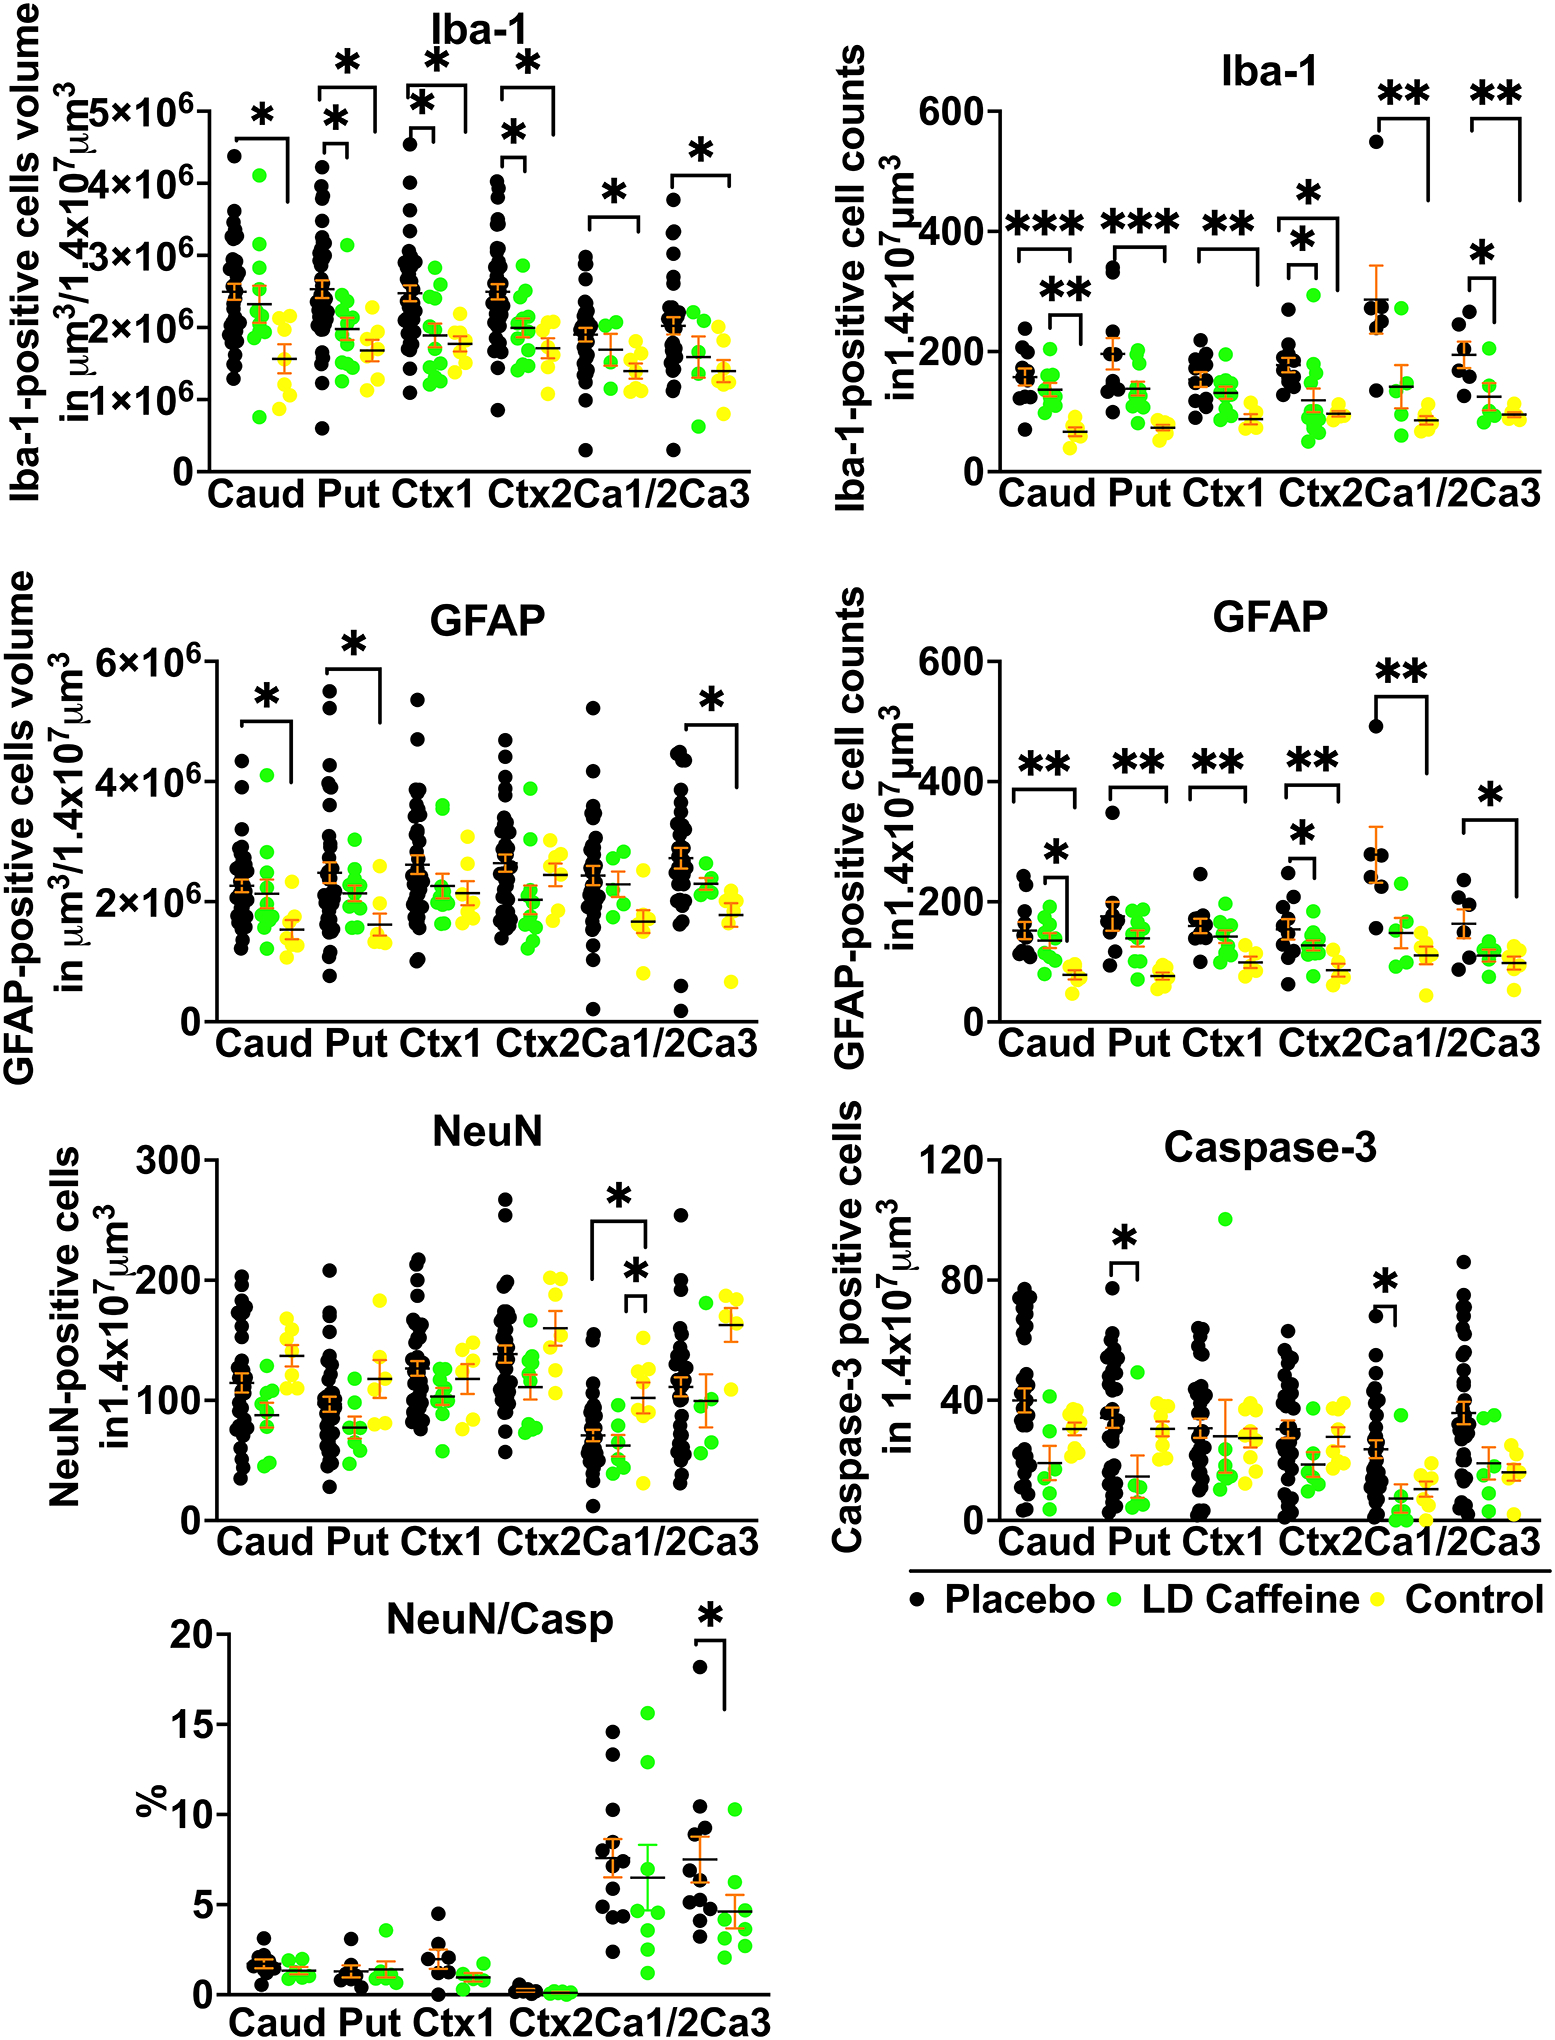
Figure 4: Histological changes in gray matter.

A, We compared quantitative changes in inflammatory markers of gliosis (GFAP) and microglial accumulation (Iba-1); neuronal counts (NeuN), cellular death markers (Casp-3) in cingulate gyrus Ctx (Ctx1), 1st parasagittal gyrus Ctx (Ctx2), caudate (Caud), putamen (Put), and Ca1/2 (Ca1/2) & Ca3 (Ca3) of the hippocampus. Placebo animals (n=33–41) were compared to the LD-caffeine treated animals (n=7–11) and controls (n=4–9) using ANOVA or Kruskal-Wallis test as appropriate. Data are presented as mean ± SEM. Brackets show significance as follows: *p < 0.05. LD-caffeine-treated group, green, Control- yellow, Placebo- black.
