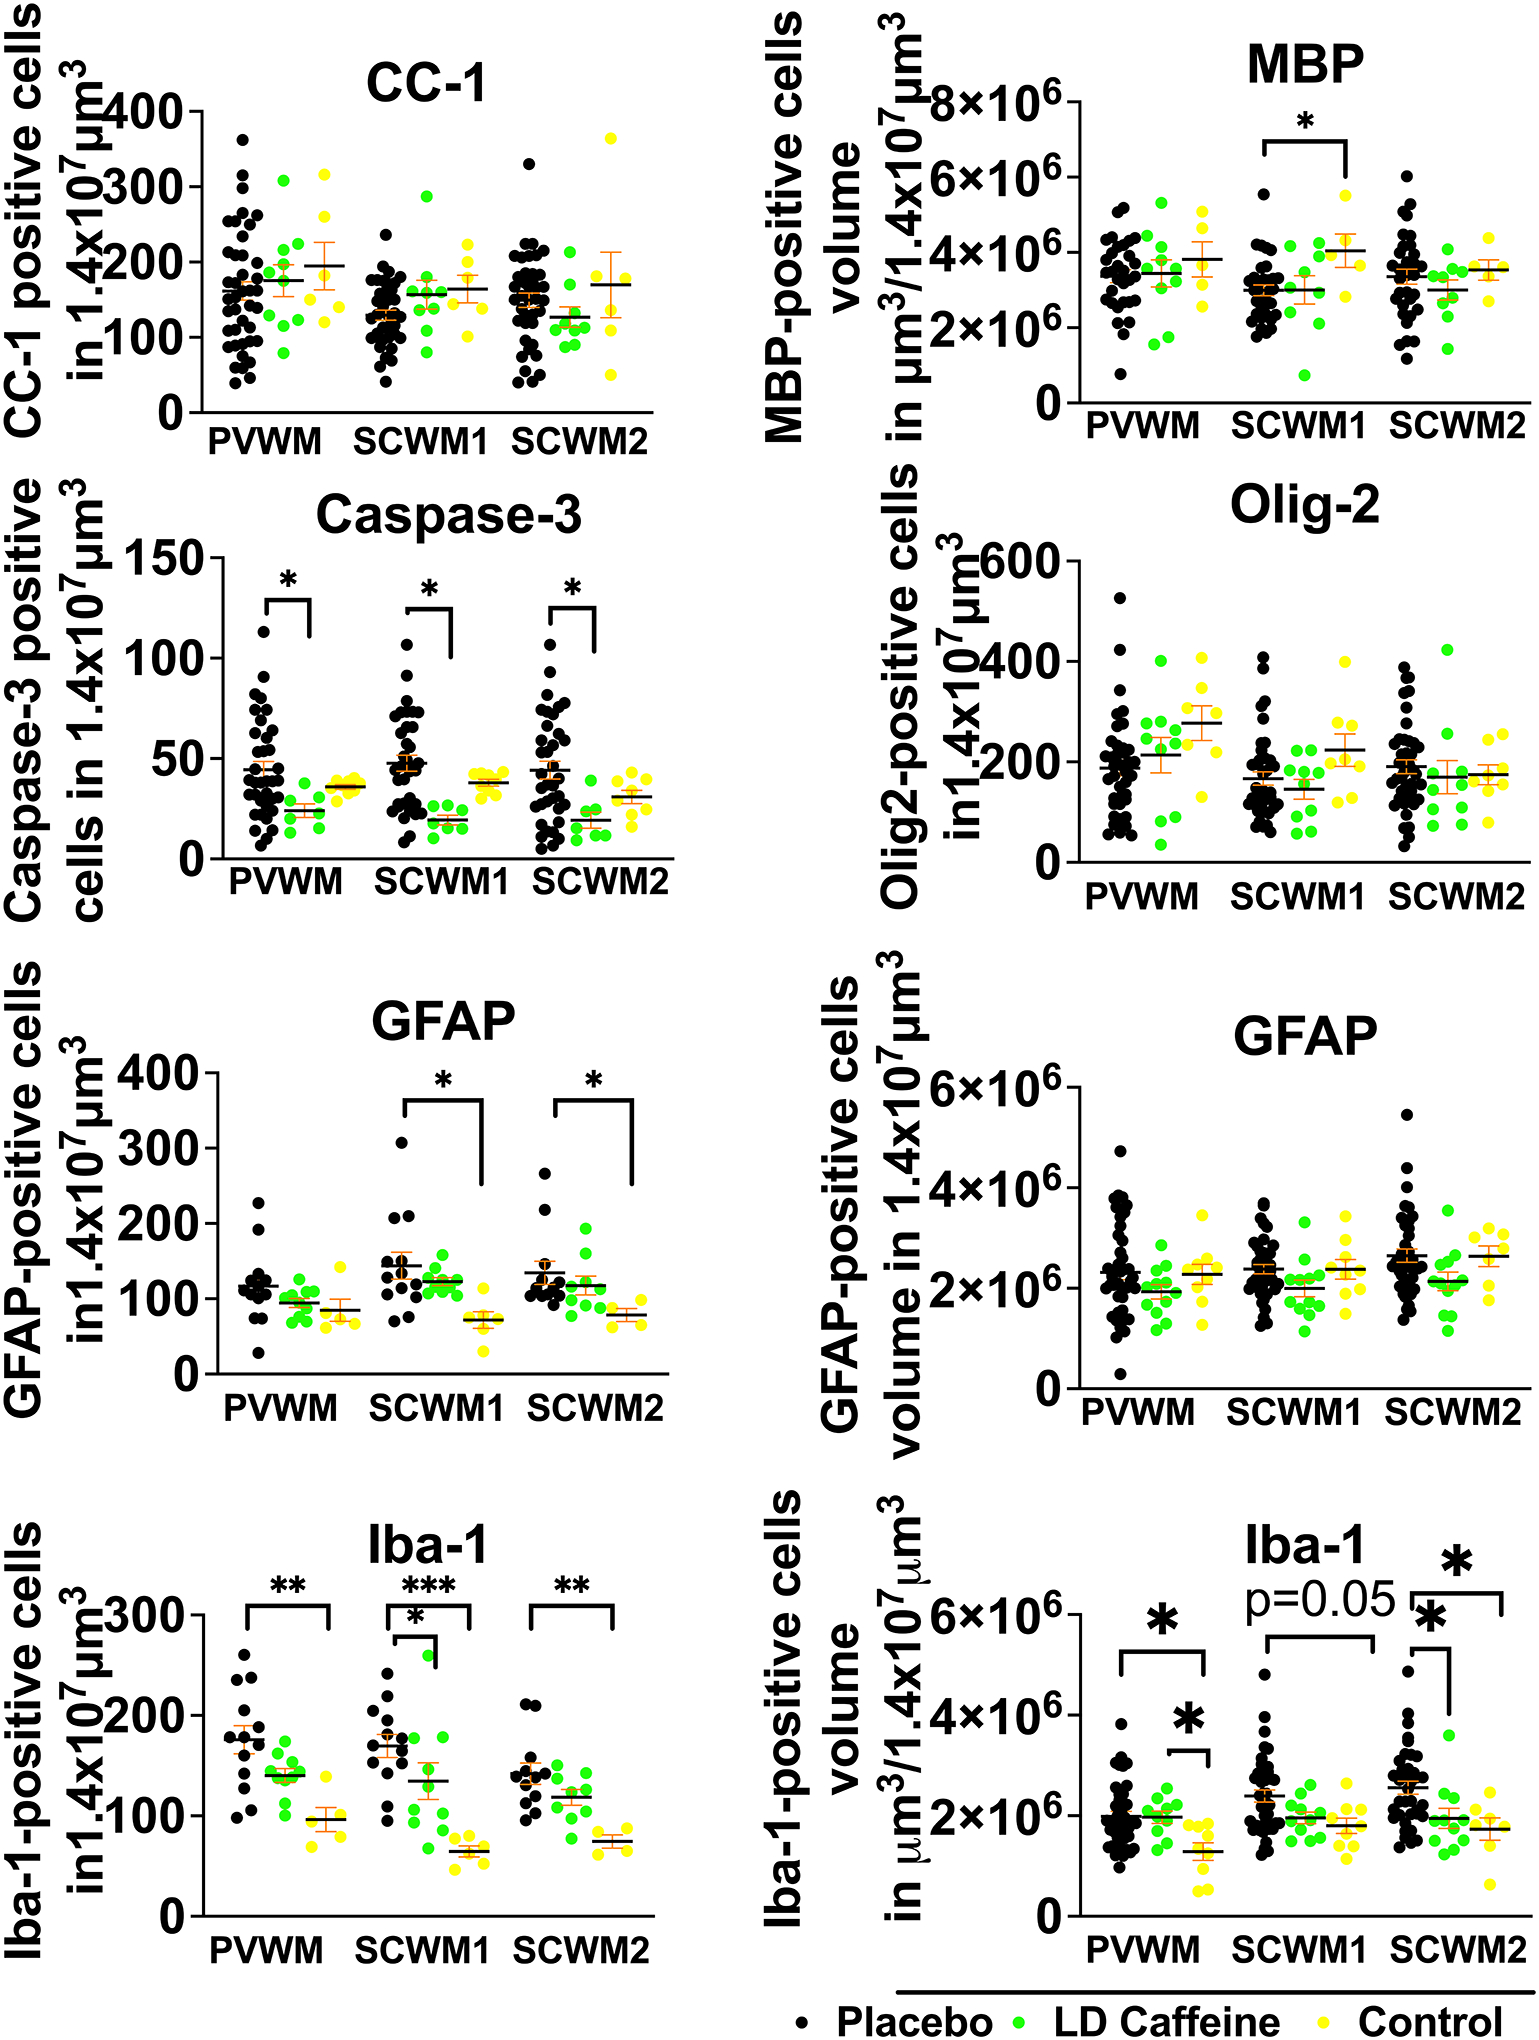
Figure 5: Quantitative analysis of white matter markers and markers of inflammation:

While overall white matter structure was not significantly altered by UCO, there is more cell death in the placebo group compared to LD-caffeine reflected by higher number of cells labeled with cleaved caspase-3. More inflammation was noted in the SCWM2 in the placebo group reflected by accumulation of microglia and higher microglial volumes. Placebo lamb histologies (n=31–41) were compared to the LD-caffeine treated animals (n=7–12) and controls (n=5–9) using ANOVA or Kruskal-Wallis test as appropriate. Data are presented as mean ± SEM. Brackets show significance as follows: *p < 0.05. LD-caffeine-treated group, green, Control- yellow, Placebo- black.
