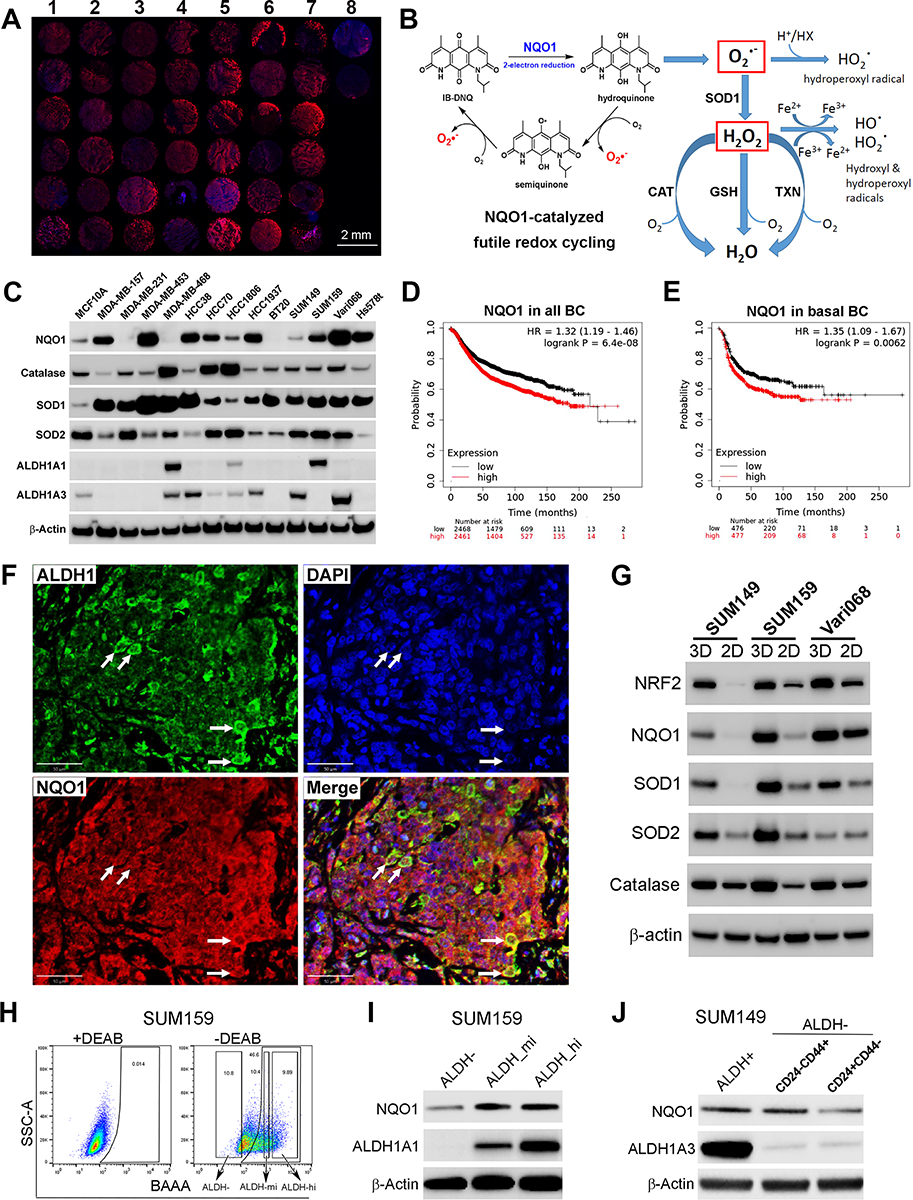
Figure 1. NQO1 and related antioxidant enzyme expression in TNBC tissues, cell lines and CSC populations.

A, Immunofluorescent labeling of NQO1 in a human TNBC tissue array (column1–7) vs. two normal mammary tissues (column 8). Scale bar: 2mm. B, NQO1-catalyzed futile redox cycle from IB-DNQ. C, NQO1 and related antioxidant enzyme expression in 13 TNBC cell lines vs. MCF10A. D-E,NQO1 expression predicts poor RFS in a patient cohort containing all BC subtypes (D) and basal BC (E). F, Double labeling of TNBC tissues using specific antibodies against NQO1 and ALDH1. Bar: 50 μm. G, NQO1 and its related antioxidant enzyme expression in tumorspheres vs. 2D adherent cells. H-I, ALDHhi, ALDHmed and ALDH− bulk tumor cells were sorted based on ALDEFLUOR assay (H) and examined by immunoblotting with ALDH1A1 and NQO1 antibodies (I). J, NQO1 expression in ALDH+ and ALDH−CD24−CD44+ CSCs vs. bulk tumor cells of SUM149.
