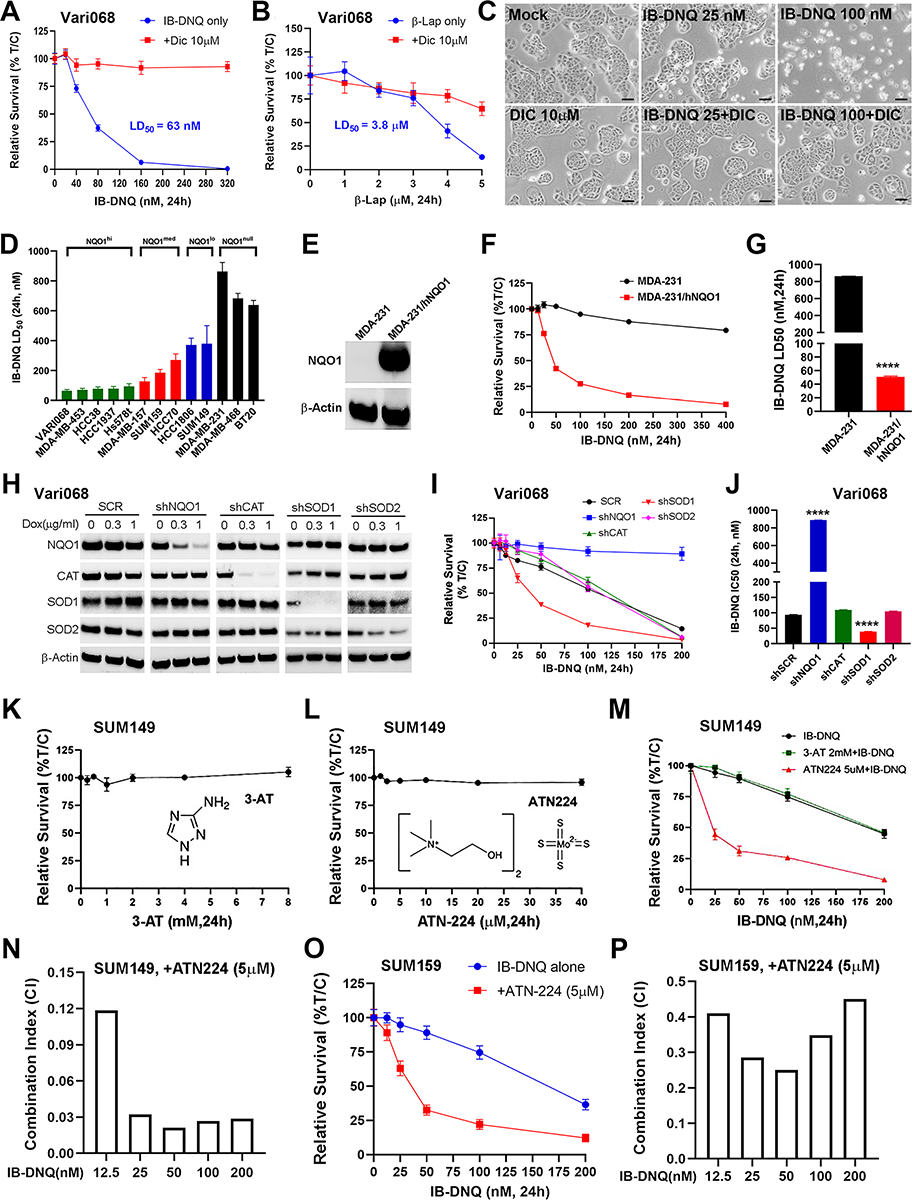
Figure 2. IB-DNQ is more potent and specific than β-lap in killing TNBC cells and genetic or pharmacological inhibition of SOD1 synergistically enhances IB-DNQ-elicited lethality.

A-B, LD50 of IB-DNQ (A) vs. β-lap (B) in Vari068 BC cells treated with or without DIC (n=6 wells). C, Vari068 cells treated with Mock, DIC (10 μM), IB-DNQ (25 and 100nM), or IB-DNQ+DIC (10μM) for 24h and examined by light microscopy. Scale bar: 50 μm. D, IB-DNQ LD50 in 13 TNBC cells (n=2). E-G, NQO1 expression in NQO− MDA-MB-231 (E) renders these cells sensitive to IB-DNQ (F, n=6 wells) with LD50 < 50nM (G). ****: P<0.0001 vs. NQO− cells (n=2, unpaired student’s t-test). H-J, Dox-inducible KD of NQO1, CAT, SOD1 and SOD2 in Vari068 validated by immunoblotting with respective antibodies (H), and relative survival curve (I, n=6 wells) and IC50 (J) of Vari068 cells with KD of NQO1, CAT, SOD1 or SOD2 vs. SCR cells following IB-DNQ treatment. ****: p< 0.0001 vs. shSCR (n=2, unpaired student’s t-test). K-L, Relative survival of SUM149 treated with 3-AT (K) or ATN224 (L) at different doses for 24h (n=6 wells). M-N, Relative survival of SUM149 cells treated with IB-DNQ alone or together with ATN224 or 3-AT (n= 6 wells, M) and combination index (CI) of ATN224 (5 μM) with IB-DNQ from 12.5–200 nM in SUM149 (N). O-P, Relative survival of SUM159 cells treated with IB-DNQ alone or with ATN224 (n=6 wells, O) and CI of ATN224 with IB-DNQ from 12.5–200 nM in SUM159 (P).
