
Figure 5. IB-DNQ in combination with ATN224 synergistically enhances total ROS and mitoROS production resulting in loss of mitochondrial membrane potential.
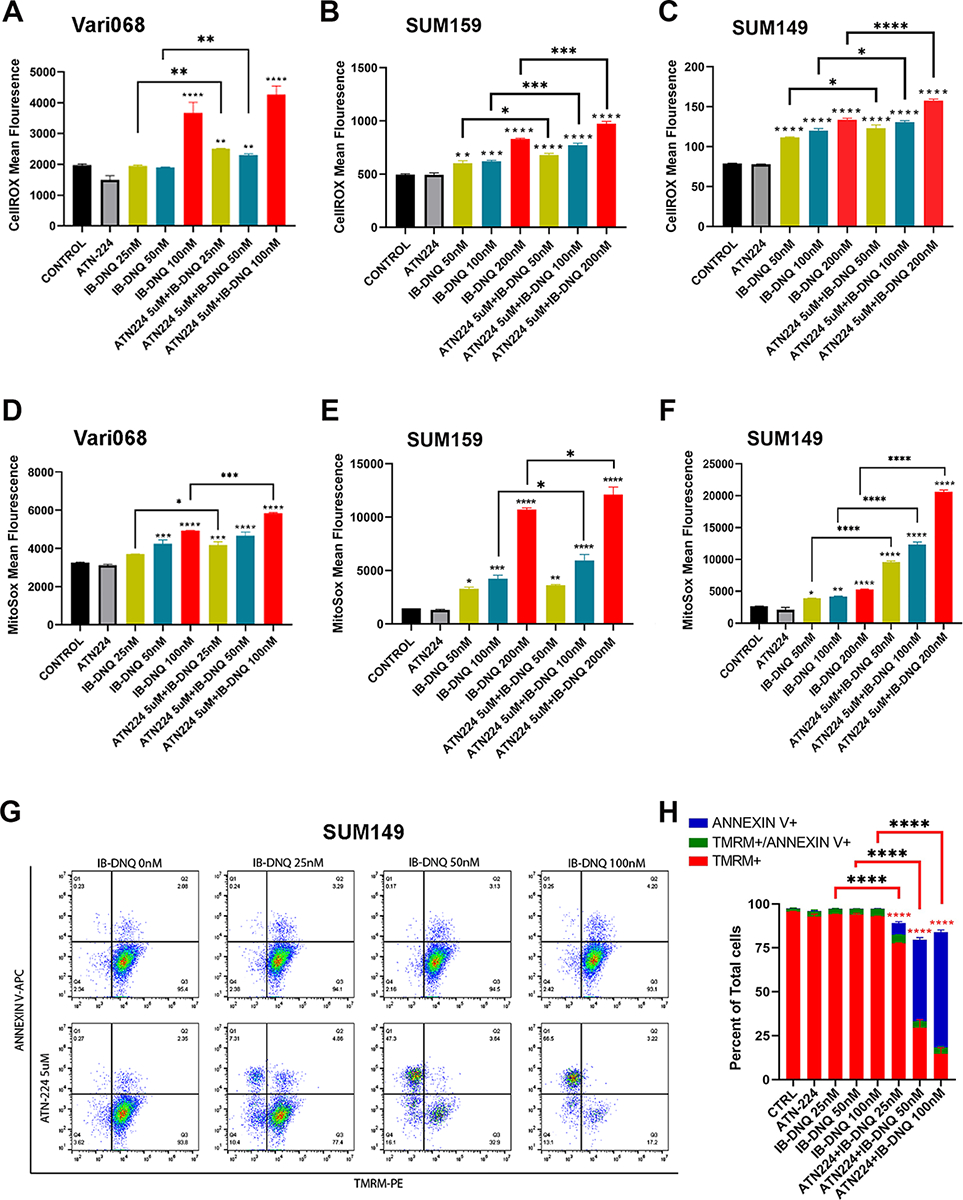
A-F, Vari068, SUM159 and SUM149 cells were treated with Control (DMSO), ATN224 (5 μM), IB-DNQ alone or IB-BNQ+ATN224 for 20h and examined by CellROX (A-C) or MitoSOX (D-F) labeling followed by flow cytometry. G-H, SUM149 cells treated with IB-DNQ (0–100 nM) alone or together with 5 μM of ATN224 for 20h were stained with AnnexinV-APC plus TMRM-PE and examined by flow cytometry (G), and % of TMRM+, TMRM+AnnexinV+ and AnnexinV+ cells was plotted (H). *, **, ***, ****: P< 0.05, 0.01, 0.001 or 0.0001 vs. Control or indicated by brackets, n=3, one-way ANOVA for A-F and H.