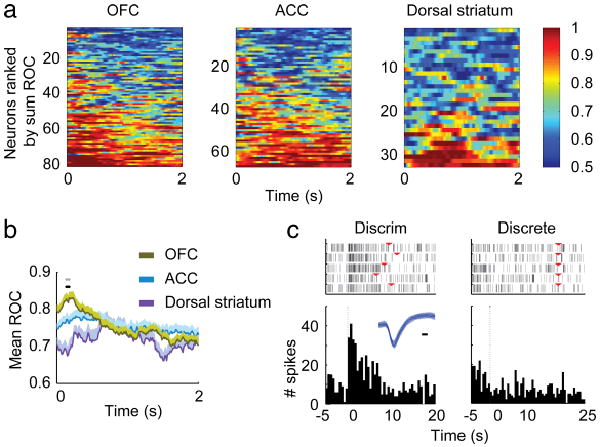
Figure 7.

Selectivity between the discriminative cue and discrete cue using ROC analysis. Only responsive neurons (determined as in Fig. 6) to either one or both cue types were used for this analysis. a, A sliding window (0.5 s wide, 0.01 s steps) was used to compare the neuronal responses during the first 2 s of the two cues. Figures were plotted by ordering neurons from top to bottom by increasing sum of the ROC value. b, Mean ROC values for all neurons from a. Black dots indicate the time periods of differences among regions, the gray dots are the points that showed significant difference between OFC and ACC. c, Example of an OFC neuron which showed more responses to the discriminative cue (left) compared with responses to discrete cue (right). Inset shows the waveform of the neuron, black bar = 0.1 ms. The red triangles on the raster plots indicate the onset of the discrete cue on the left panel, and offset of the discrete cue on the right panel.
