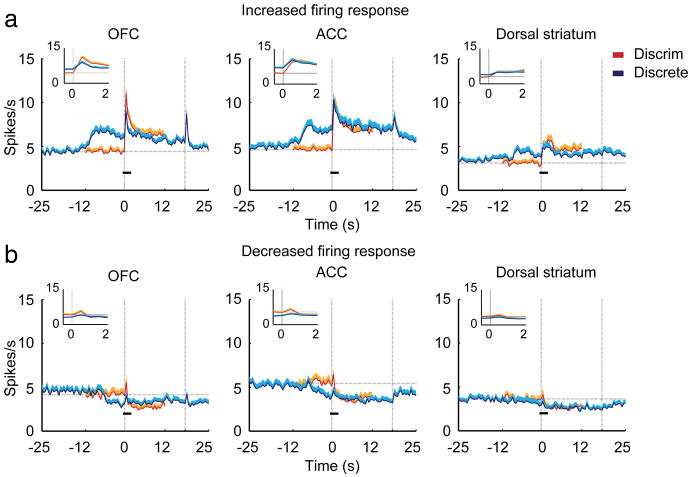
Figure 8.

Population responses of all neurons from Figure 5, subdivided according to whether their firing rate increased (a) or decreased (b) relative to baseline following cue onset. Note the more sustained response of ACC neurons that either increased or decreased firing following onset of the discrete cue. For the discriminative cue, the breakdown by region was: OFC, 127 increased, 61 decreased; ACC, 102 increased, 55 decreased; STR, 72 increased, 62 decreased. For the discrete cue, the breakdown by region was: OFC 116 increased, 72 decreased; ACC, 92 increased, 65 decreased; dorsal striatum, 74 increased, 60 decreased.
