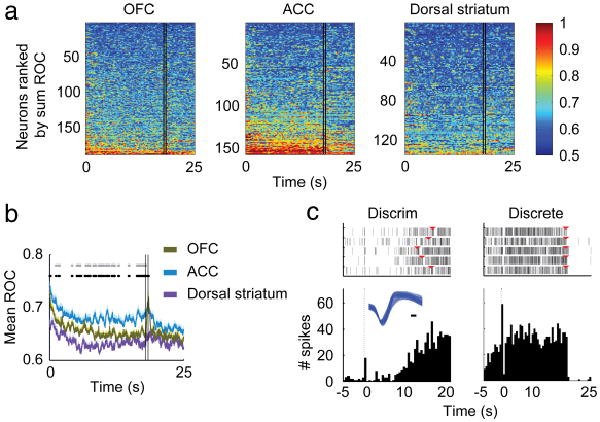
Figure 9.

Selectivity between the discrete cue and baseline using ROC analysis demonstrating the sustained response of ACC neurons to the discrete cue. a, A sliding window (0.5 s wide, 0.01 s steps) was used to compare the neuronal responses to baseline. Area under the ROC curve was calculated across all the neurons analyzed. The figures were constructed by sorting the neurons from top to bottom by increasing sum of the ROC value. The two vertical black lines (at T = 17.5 s and T = 18 s) represent the overlapping times of the sliding window and cue offset at 18 s. b, Mean ROC values for all neurons from a. Black dots represent the times of differences among regions and gray dots are the points that are significantly different between OFC and ACC. (c) Example of an ACC neuron which started its response toward the end of the discriminative cue (left) and continued to respond throughout the discrete cue (right). Inset shows the waveform of the neuron, black bar = 0.1 ms. The red triangles on the raster plots indicate the onset of the discrete cue on the left panel, and offset of the discrete cue on the right panel.
