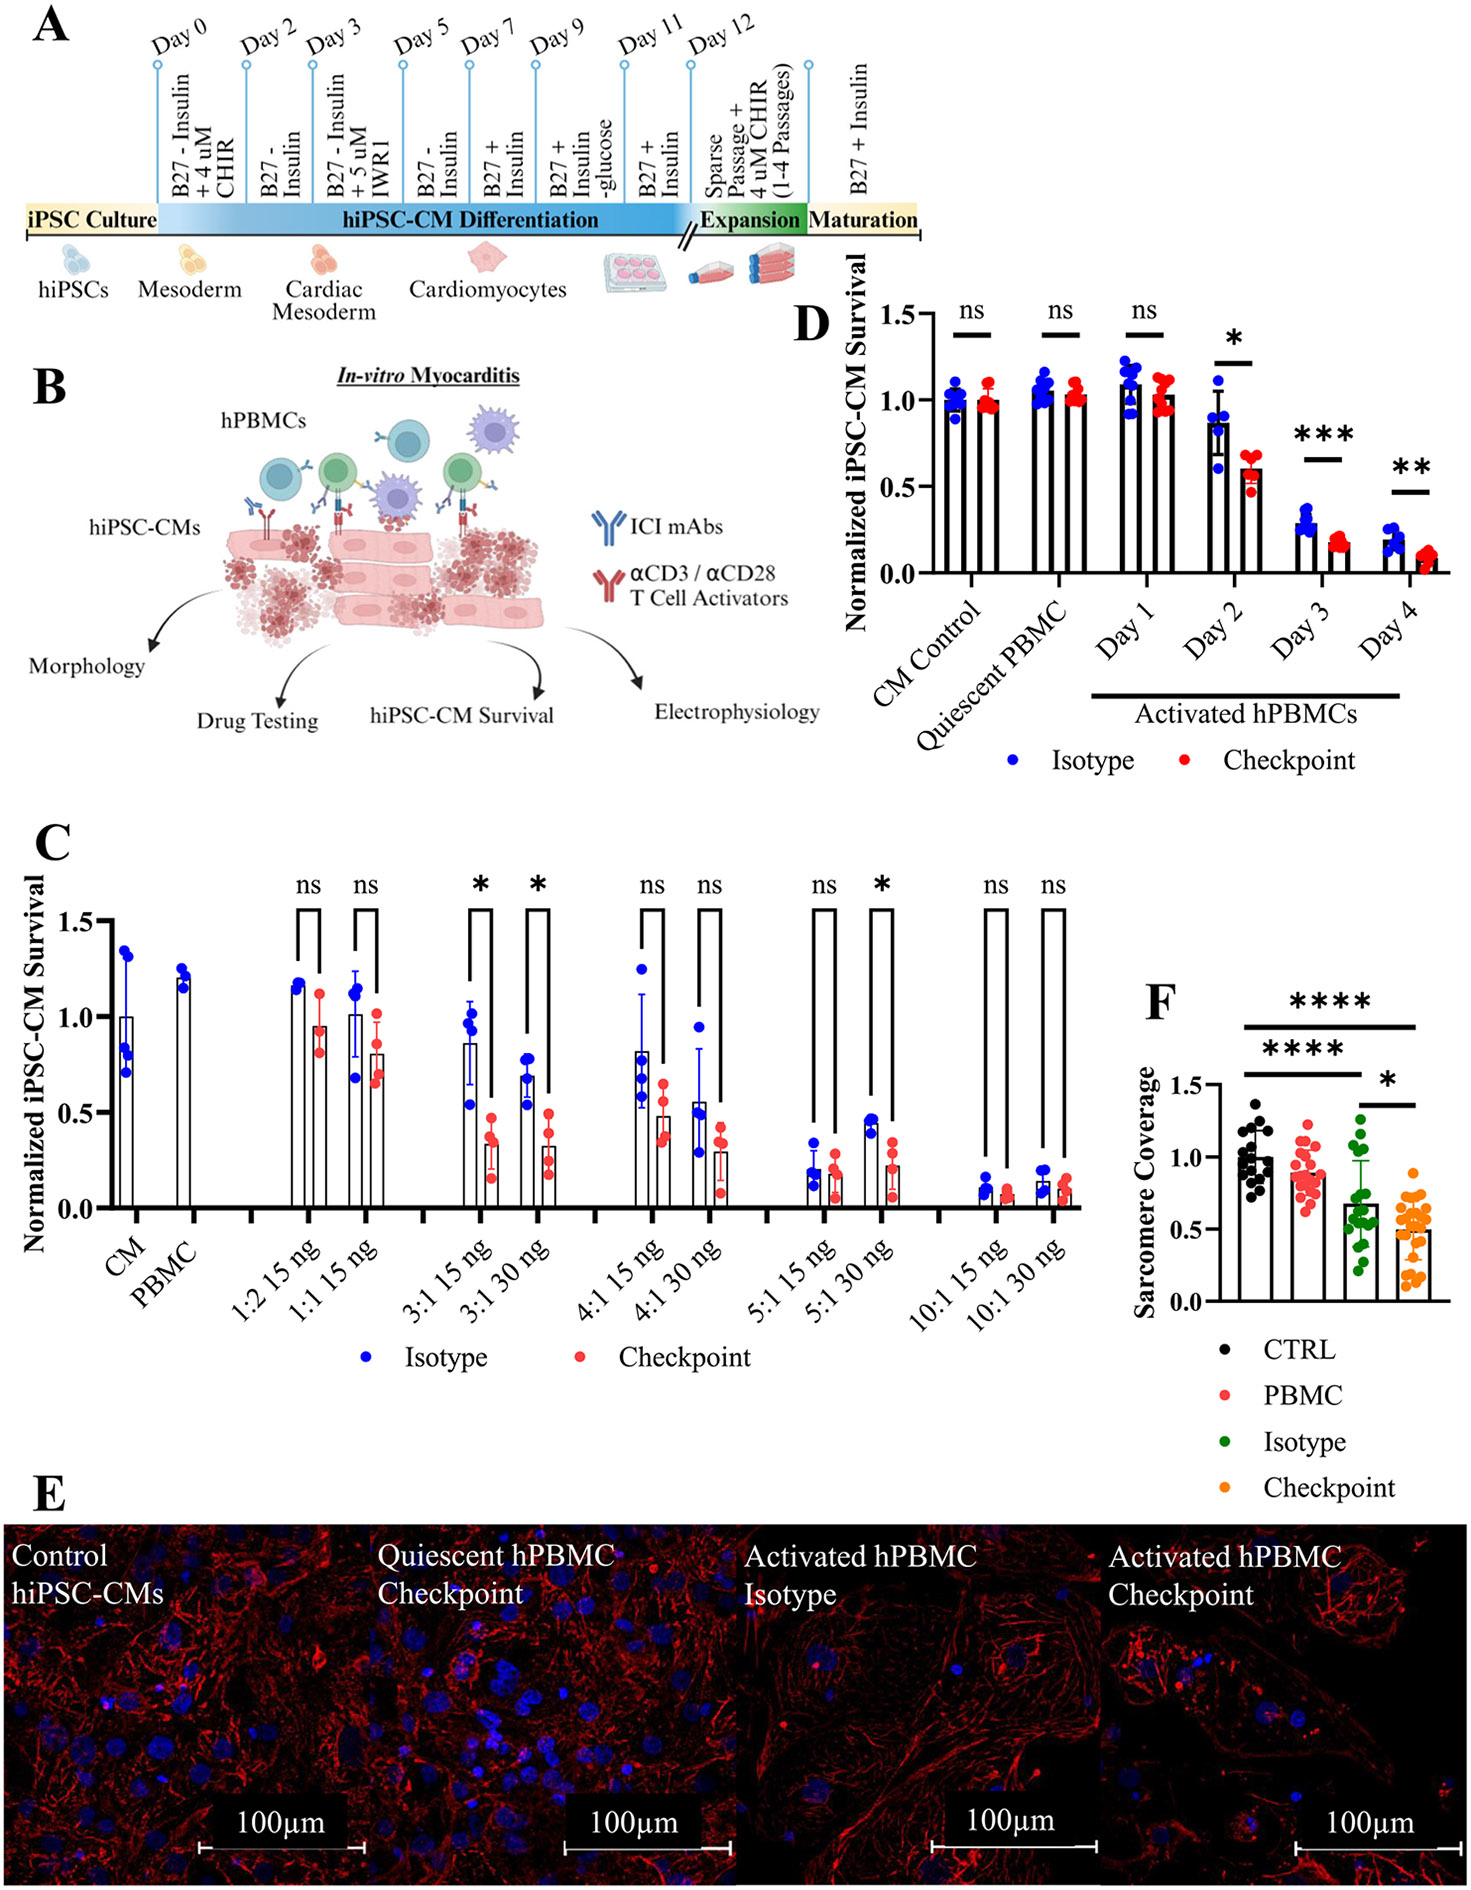
Fig. 1. Setup for tissue culture myocarditis setup and model phenotype.

A) Schematic for hiPSC-CM differentiation and expansion.
B) Tissue Culture Myocarditis Setup.
C) Normalized hiPSC-CM survival at 72 h. Ratio represents the number of hPBMCs relative to the number of hiPSC-CMs. T cell activation mAbs (αCD3 & αCD28) dosages are indicated by ng/mL. Technical replicates indicated by individual dots on graph, n = 4 technical replicates per condition. Isotype treated conditions are shown in blue. ICI biosimilar treated conditions are shown in red.
D) Viability assay demonstrating impaired iPSC-CMs survival after 48–96 h. co-culture with activated hPBMCs and checkpoint inhibitors. Technical replicates indicated by individual dots on graph: CM Control (n = 8), quiescent PBMC (n = 9), Day 1 (n = 10), Day 2 (n = 6), Day 3 (n = 10), Day 4 (n = 6).
E) Immunocytochemistry staining of cTnT(red) and DAPI(blue) showing perturbations to sarcomere structure induced by activated hPBMCs and exacerbated by ICI treatment at 72 h.
F) Proportion of intracellular area containing cTnT obtained by particle analysis. CTRL (n = 17), PBMC (n = 21), Isotype (n = 22), Checkpoint (n = 28) individually gated hiPSC-CMs. Normalized to untreated control hiPSC-CMs.
*P < .05, **P < .01, ***P < .001, ****P < .0001 by unpaired t-test with Welch's correction for unequal variances for (B), Dunnett's multiple comparisons test for (C), and Tukey's multiple comparisons test for (E).
Error bars indicates mean ± s.d.
Experiments repeated >10 (A, B, C, D, E, F) times.
