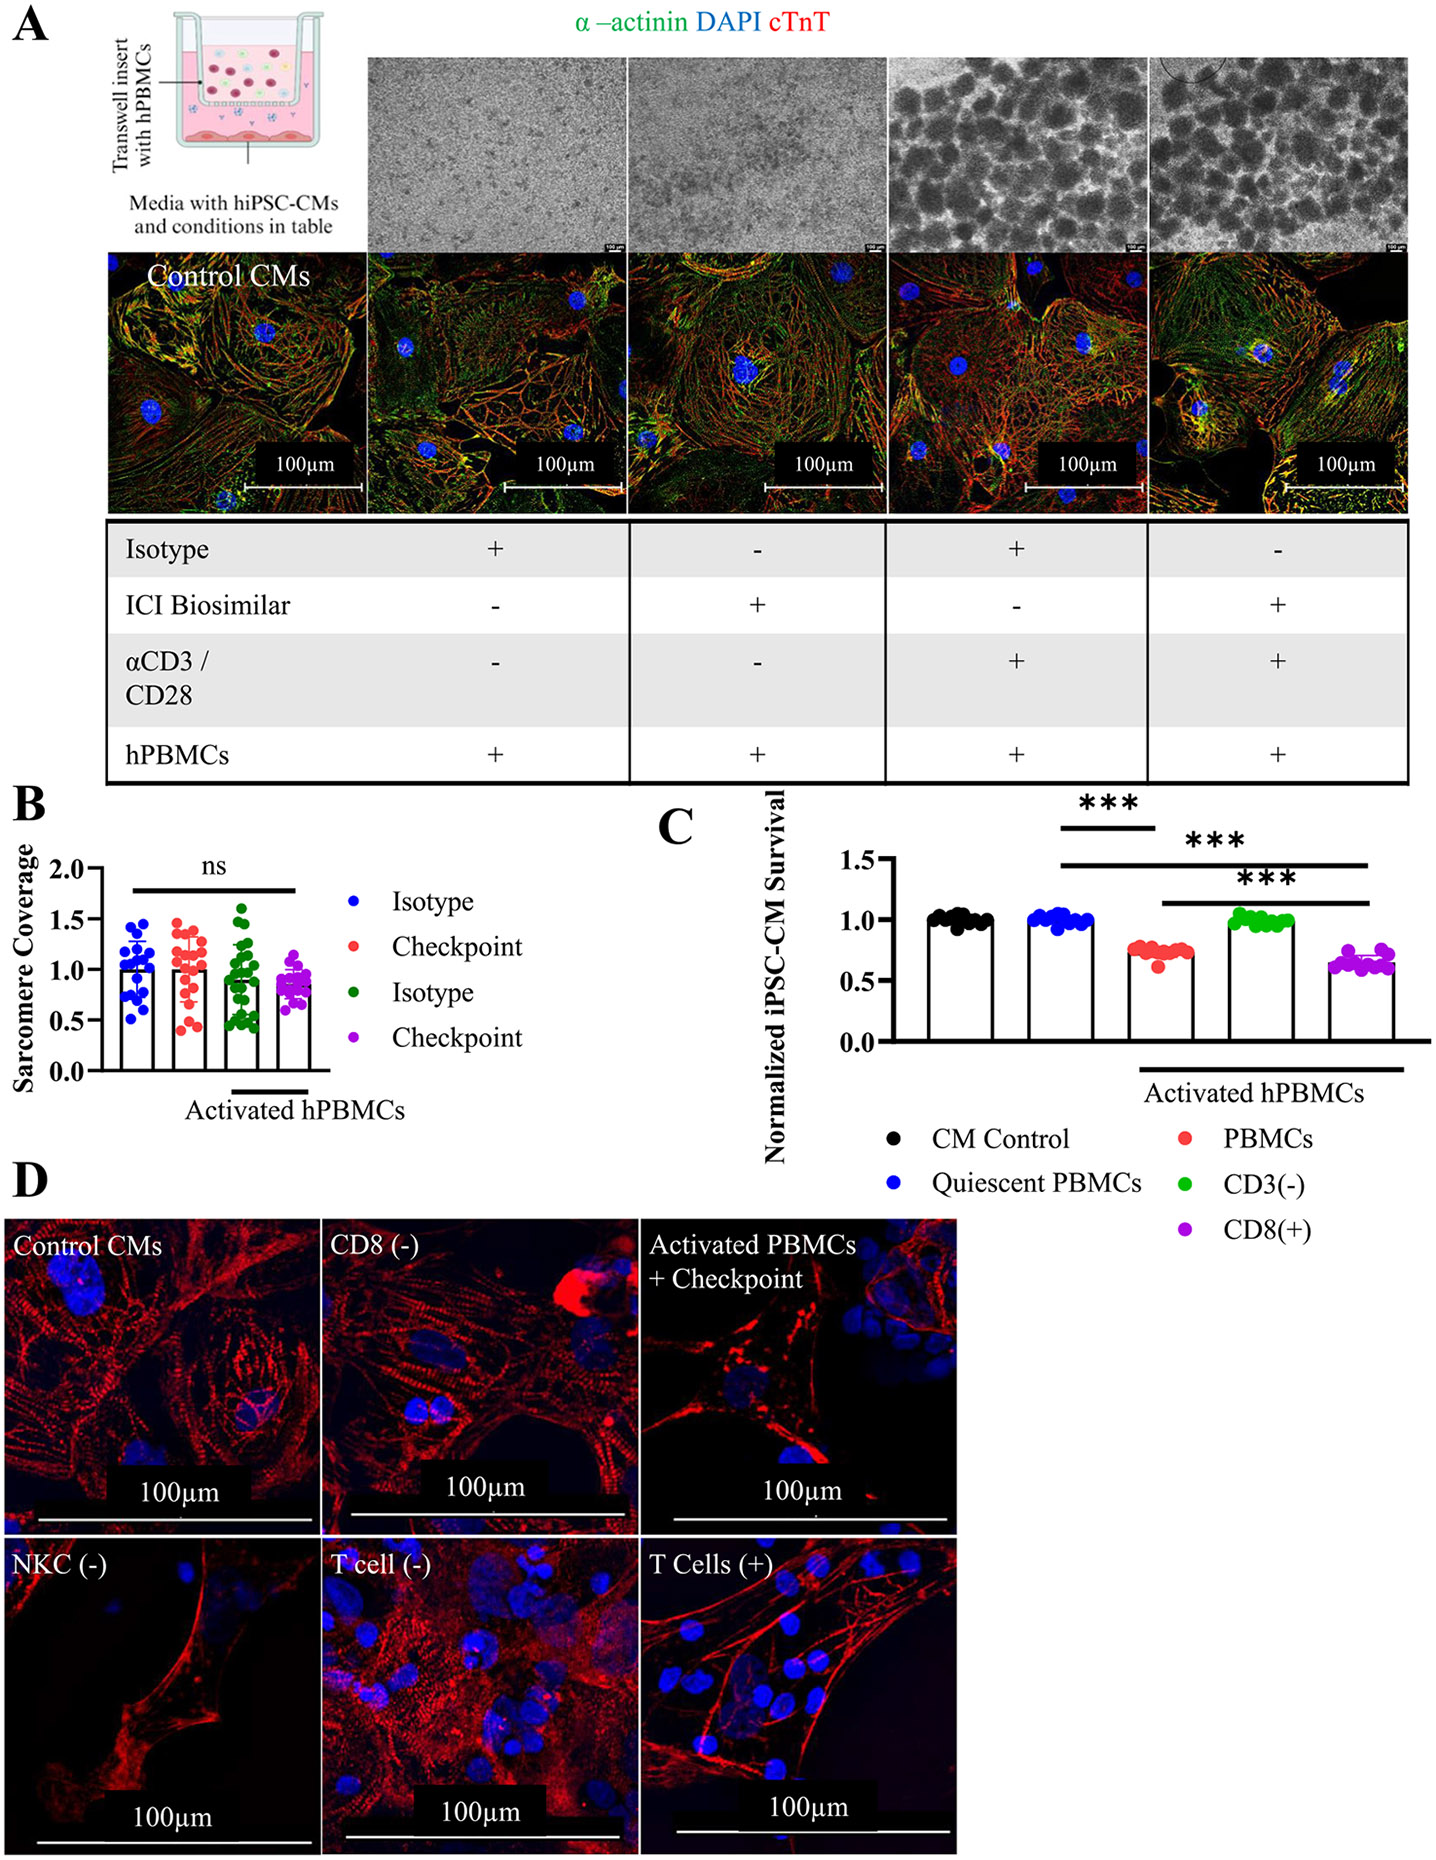
Fig. 2. Mechanisms of tissue culture myocarditis.

A) Graphical schematic of transwell assay setup conditions. Phase contrast microscopy of quiescent or activated hPBMCs after 72 h. (top) and ICC staining for hiPSC-CMs (bottom). cTnT(Red), α-actinin(green), DAPI (blue). hPBMC were cultured in a transwell insert separating them from hiPSC-CMs in the bottom of the well. Conditions included are indicated by a (+) in the underlying table. Control CMs contains hiPSC-CMs cultured in isolation.
B) hiPSC-CM sarcomere coverage obtained by particle analysis. Normalized to untreated hiPSC-CM control. Isotype (n = 18), Checkpoint (n = 20), Activated Isotype (n = 25), Activated Checkpoint (n = 18), technical replicates are individually gated cells from immunocytochemistry images.
C) Viability assay using FACS sorted hPBMCs at 72 h. Depleted populations are indicated by (−). hiPSC-CM viability normalized to untreated control hiPSC-CM condition. CD8+ and CD3+ T cells are required for myocarditis development. Technical replicates indicated on graph, n = 12 for all conditions.
D) Immunocytochemistry staining for cTnT (red) and DAPI (blue) to assess sarcomere structure at 72 h. Myocarditis was induced after specific cellular populations were stained and depleted from bulk hPBMCs. Depleted cells are indicated by (−). T cells (+) were obtained by depleting all other cell types. Sarcomere disarray is visible when CD8+ or CD3+ T cells are present.
*P < .05, ***P < .001, ****P < .0001 by one-way ANOVA with Tukey's correction for multiple comparisons for (B) and (C).
Experiments repeated 2 (A, B) and 3 (C, D) times.
