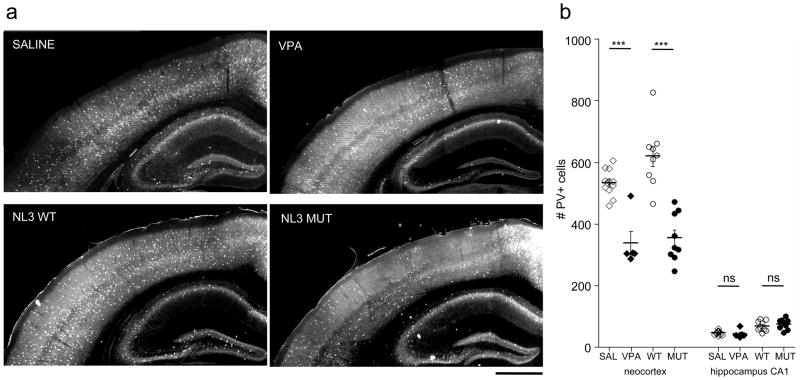
Fig 2. PV-cell deficit in VPA and NL-3 mutant mice.
a Representative photomicrographs of PV immunohistochemistry in coronal sections of saline-treated (SAL; top left), valproic acid-treated (VPA; top right) Neuroligin3 wildtype (NL3 WT; bottom left) and mutant (NL3 MUT; bottom right) mice. Scale bar: 500 μm
b Quantitative analysis of PV-cells in neocortex and hippocampal CA1 (see Suppl. Fig. 1 and Mehods for details). For all animals, the hemisphere with the lowest PV+ cell numbers was plotted. Note the specific reduction of PV-cells in the neocortex of VPA-treated and NL3 mutant mice. One-way ANOVA test: *** p<0.0001; Bonferroni multiple comparison test, p<0.001

