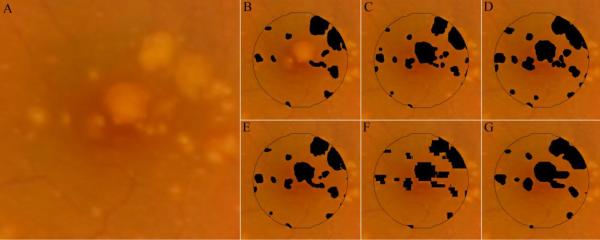
Figure 2.
Drusen maps for study eye #3. Three retinal specialists independently graded the CFP (unmarked in A) for drusen (B–D). A composite CFP drusen map, representing all areas marked as drusen by at least 2 of 3 graders, is represented as E. In order to create a projection map of drusen from SD OCT scans, interpolation of sequential OCT B-scans must be performed. This is because the 6.6mm×6.6mm field-of-view is sampled by 100 OCT B-scans. Whereas the field of view is represented by 1000×1000 pixels in the CFP images (A), there are only 100×1000 pixels in the projected OCT markings. F and G represent the interpolated OCT markings using MATLAB's 2-D cubic interpolation (interp2) function and NWE interpolation, respectively. Unless otherwise stated, the NWE interpolation (as in G) was used for comparative analysis in this study.

