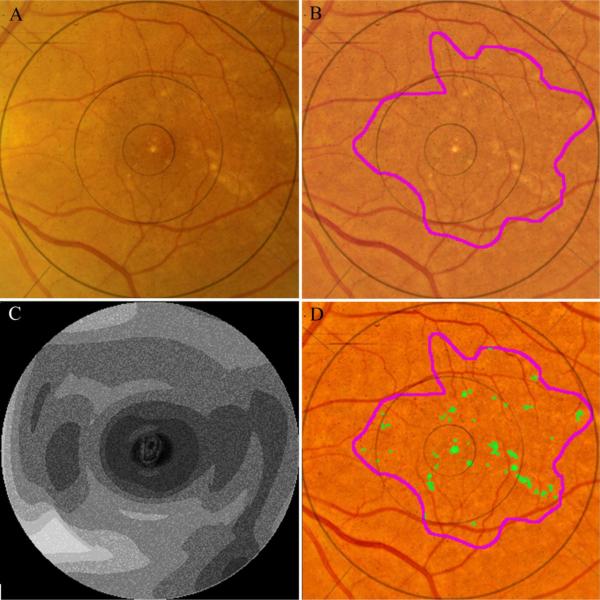
Figure 3.
Automated segmentation of drusen on CFP. The original image (A) demonstrates poorly defined drusen and pigmentation variations. The image is first enhanced and color balanced, and the drusen region of interest is interactively selected (B). The mathematical model for the image background (contour graph, C) is calculated in MATLAB. On the background leveled image (D), the drusen detection algorithm identifies multiple drusen (green).

