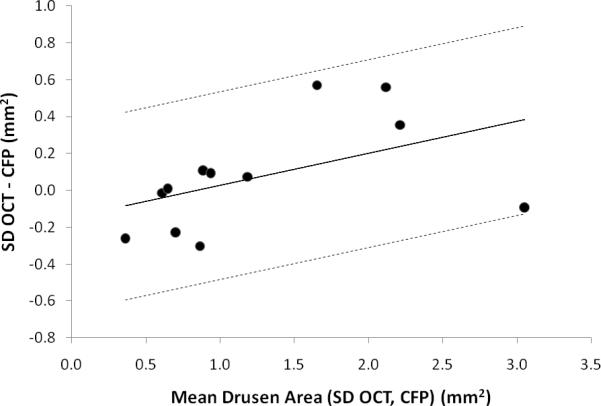
Figure 5.
Bland-Altman plot for agreement between SD OCT-based and composite CFP-based measurement of total drusen area (mm2) within the central macular area for 12 subjects with AREDS Category 3 non-neovascular AMD. To obtain this plot, the difference in total drusen area as measured with SD OCT (NWE interpolation) and composite CFP was plotted against the mean drusen area of the two measurements for each subject. A modified Bland-Altman plot, using a regression approach for nonuniform differences, accounts for the positive correlation between difference in measured drusen area and mean drusen area.27 The regression line is displayed along with the upper and lower 95% limits of agreement.

