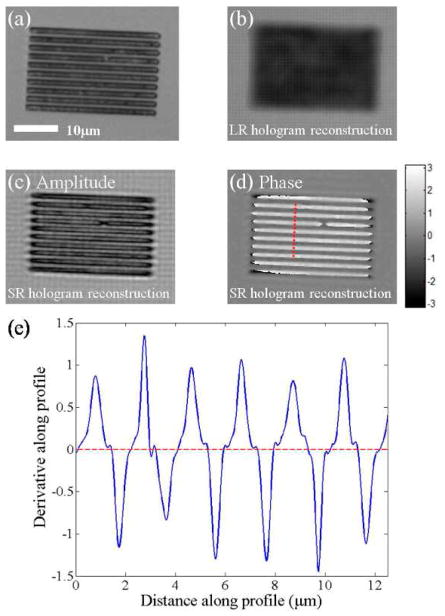
Fig. 3.
(a) Microscope image of the object captured with a 40X objective lens (NA=0.65). (b) Amplitude reconstruction of the object using a single low-resolution hologram (see Fig. 2(a)). (c) Object amplitude reconstruction using the high-resolution hologram (see Fig. 2(c)) obtained from Pixel SR using 36 LR images. (d) Object phase reconstruction obtained from the same high-resolution hologram using Pixel SR. The object phase appears mostly positive due to phase wrapping. (e) The spatial derivative of the phase profile along the dashed line in pane (d). As explained in the text, this spatial derivative operation yields a train of delta functions with alternating signs, broadened by the PSF, which sets the resolution.

