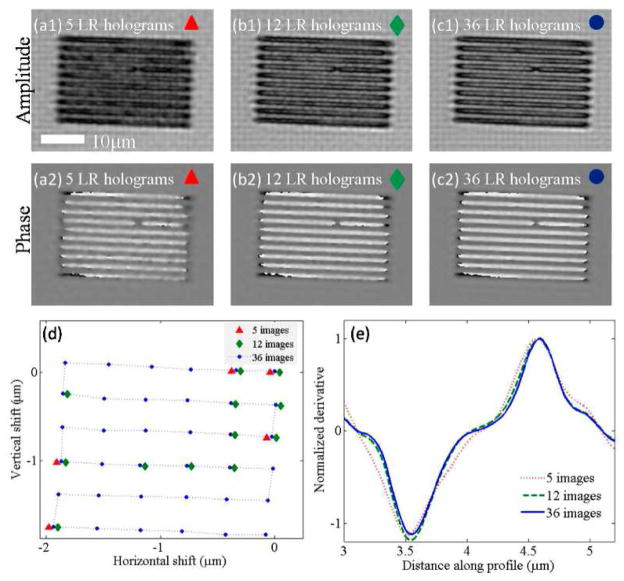
Fig. 4.
Comparison of pixel SR results using different number of LR holograms. Panes (a1-a2), (b1-b2), and (c1-c2) show the reconstructed amplitude and phase images of the same object using 5, 12, and 36 LR holograms, respectively. In (d), the sub-pixel shifts of the randomly chosen subsets of LR holograms are shown. In (e), the normalized spatial derivative profiles of the recovered phase images for each case (a2, b2 and c2) are shown, similar to Fig. 3(e).

