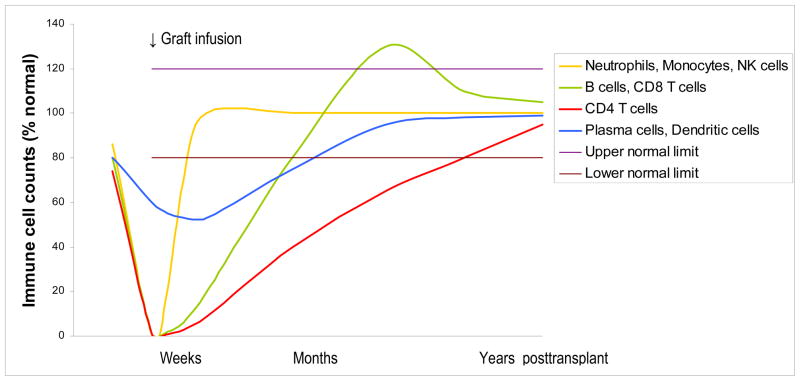
FIGURE 1.
Approximate immune cell counts (expressed as percentage of normal counts) peri– and post–myeloablative hematopoietic cell transplantation. Nadirs are higher and occur later after nonmyeloablative than myeloablative transplantation, as recipient cells persist after nonmyeloablative transplant for several weeks to months (in the presence of GVHD) or longer (in the absence of GVHD). The orange line represents the innate immune cells (e.g., neutrophils, monocytes, and natural killer [NK] cells), the recovery of which is influenced by the graft type (fastest with filgrastim-mobilized blood stem cells, intermediate with marrow, and slowest with umbilical cord blood). The green line represents the recovery of CD8+ T-cells and B-cells, the counts of which may transiently become supranormal. B-cell recovery is influenced by graft type (fastest after cord blood transplant) and is delayed by GVHD and/or its treatment. The blue line represents the recovery of relatively radiotherapy/chemotherapy-resistant cells such as plasma cells, tissue dendritic cells (e.g., Langerhans cells) and, perhaps, tissue macrophages/microglia. The nadir of these cells may be lower in patients with acute GVHD due to graft-versus–host-plasma cell/Langerhans cell effect. The red line represents CD4+ T-cells, the recovery of which is influenced primarily by T-cell content of the graft and patient age (faster in children than adults). From Storek J: Immunological reconstitution after hematopoietic cell transplantation – its relation to the contents of the graft. Expert Opinion on Biological Therapy (Informa) 8(5):583–597, 2008.

