
Figure 3.
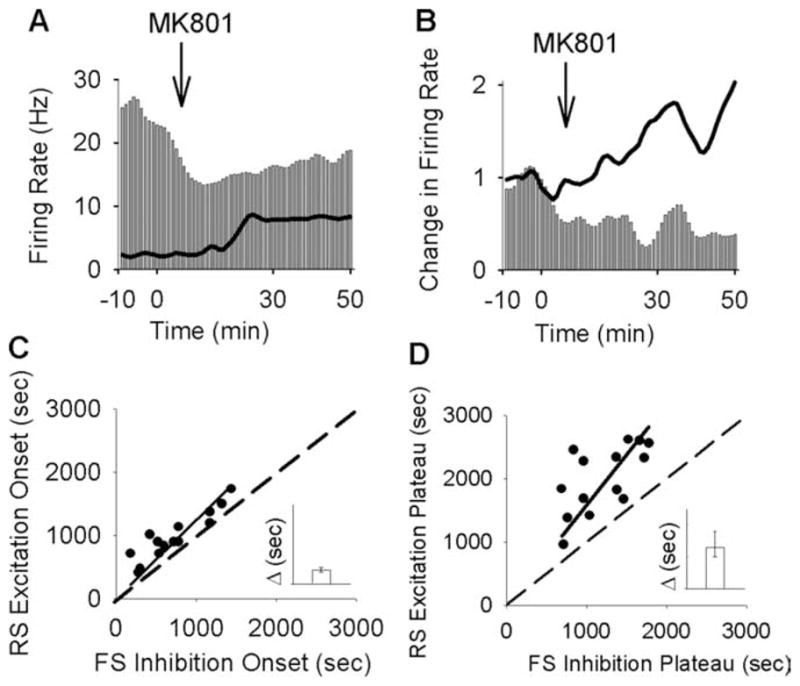
MK801 inhibition of interneurons precedes its excitation of pyramidal cells. A, Superimposed firing-rate histogram of simultaneously recorded pairs of interneurons (bar graph) and pyramidal neurons (solid line). Arrow indicates the time of MK801 injection. Bin size, 1 min. B, Normalized firing rate histogram of another pair of simultaneously recorded interneuron (bar graph; baseline firing rate, 17.26 Hz) and pyramidal neuron (solid line; baseline, 2.86 Hz). Inset, Finer timescale with 20 s bins. C, D, Putative interneurons preceded their concurrently recorded pyramidal neurons both in the onset of their inhibition (C) and in reaching the inhibitory plateau (D). Each dot in the scatter plots depicts the post-MK801 delay to onset (C) or plateau (D) of inhibitory response for interneuron/s recorded during a single session versus the delay to onset (C) or plateau (D) of excitatory response for the average pyramidal neurons in the same session. A dashed line indicates no change from baseline and a solid line depicts the linear regression. Inset, Median and 95% confidence intervals of the difference in the delay between inhibitory versus excitatory response onset (C) or plateau (D), with a positive value indicating inhibition preceding the excitation (y-axis range, 0 –1500 s).