
Figure 1.
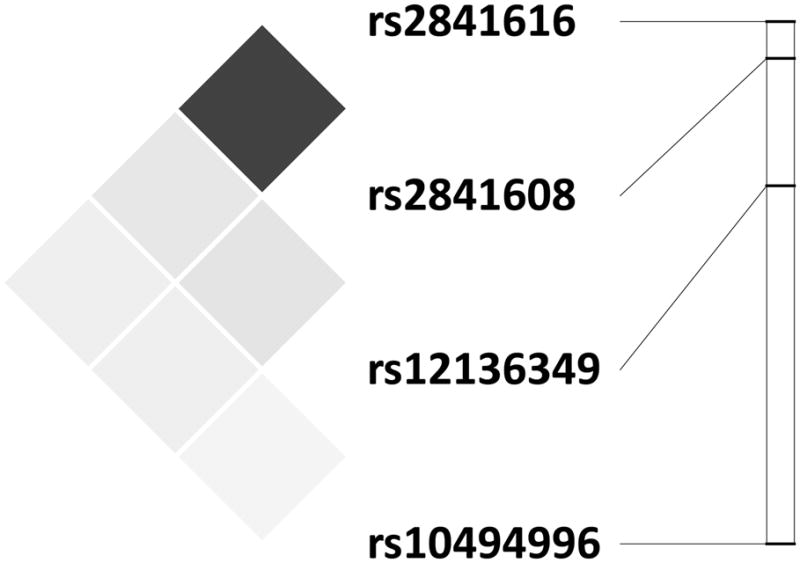
Location of and linkage disequilibrium among TREK1 SNPs. The relative locations of TREK1 SNPs are presented on the right (graphic: chromosome 1, from top to bottom: 213.225 Mb – 213.501 Mb). The LD plot (presented on the left) uses r2 as a measure LD which ranges from 1 (or complete LD indicated by black squares) to 0 (or absence of LD, indicated by white squares). In our sample we observed high LD between rs2841608 and rs2841616 (r2 = .80) with low LD among all others (r2 ≤ .14). Plotted using Haploview [Barrett et al., 2005].