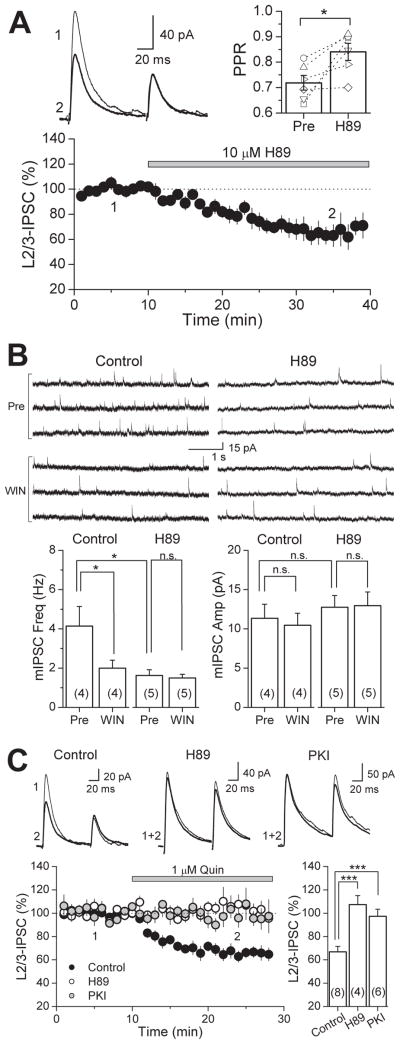
Figure 4. Inhibiting PKA activity with H89 reduces GABA release and occludes WIN- and quinpirole-suppression of GABAergic transmission in the rat PFC.
(A) Time course of H89-suppression of IPSC amplitudes in the rat PFC (n = 6 cells). Top left, representative average IPSC traces from a single experiment, obtained at time points indicated. Top right, PPR plot before and after H89 application. PPR of L2/3-IPSCs significantly increased. Open symbols represent the PPR of individual experiments. (B) WIN-suppression of miniature IPSC (mIPSC) frequency in control is absent in slices preincubated in 10 μM H89. Top left, three representative mIPSC traces from a single control experiment before and after WIN application. Top right, three representative mIPSC traces from a single H89 experiment before and after WIN application. (C) Quinpirole-suppression of IPSC amplitudes in control (black circles is absent in slices preincubated in either 10 μM H89 (white circles) or 2.5 μM PKI 14-22 (gray circles). Top, representative average IPSC traces from single experiments. Bottom right, summary plot of quinpirole-suppression in control and block under PKA inhibition by H89 and PKI 14-22. The number of experiments for each condition is indicated in parenthesis. * p<0.05, *** p<0.005.

