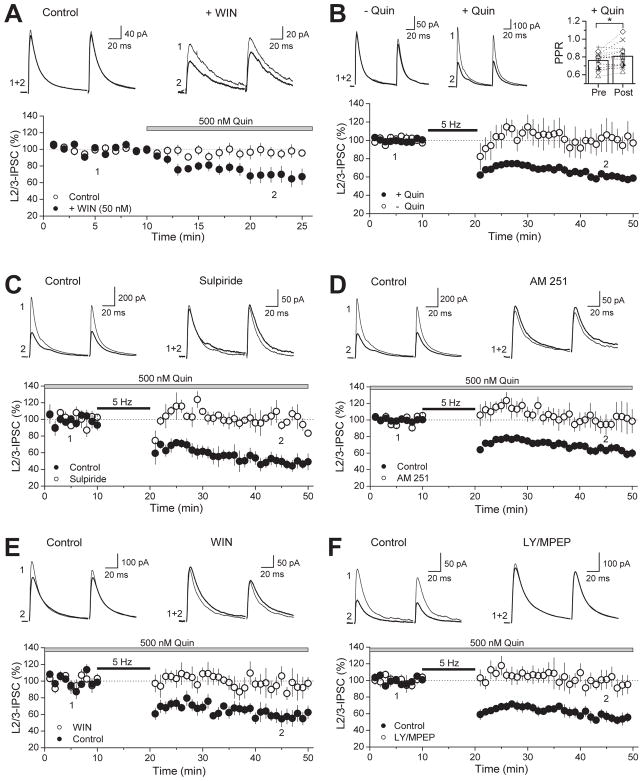
Figure 5. I-LTD can be triggered by a 5 Hz-train of synaptic stimulation in the presence of low dose quinpirole.
(A) Time course of 500 nM quinpirole effect on IPSC amplitude in the presence (black circles) or absence (white circles) of 50 nM WIN. Preincubation with a submaximal dose of WIN (+WIN) reveals the suppressive effect of an otherwise ineffective dose of quinpirole (control). Top, representative average IPSC traces from single experiments obtained from the time points indicated. (B) Time course plot of average IPSC amplitudes before and after 5 Hz stimulation train in the absence (white circles) or presence (black circles) of quinpirole. Responses only persistently depressed as a result of 5-Hz stimulation when D2R agonist is in the bath (+Quin). Top left, Representative average IPSC traces from single experiments obtained from the time points indicated. Top right, plot of PPR before and after train in the presence of D2R agonist. Open symbols represent single experiments. (C) Time course of control I-LTD (black circles) and the absence of I-LTD under D2R antagonism with 10 μM sulpiride (white circles). Top, representative average IPSC traces from a single control and sulpiride block experiment. (D) Time course of control I-LTD (black circles) and the absence of I-LTD in the presence of 4 μM AM251 (white circles). Top, Representative average IPSC traces from a single control and AM 251 block experiment. (E) Time course of control I-LTD (black circles) and its absence in slices that were preincubated in 5 μM WIN (white circles). Maximal CB1R activation occluded I-LTD as depicted in the summary bar plot on the top right. Top, Representative average IPSC traces from a single control and WIN occlusion experiment. (F) Time course of control I-LTD (black circles) and the lack of I-LTD in the presence of group I mGluR antagonists (white circles). Top, Representative average IPSC traces from single control and block experiments. * p<0.05.

