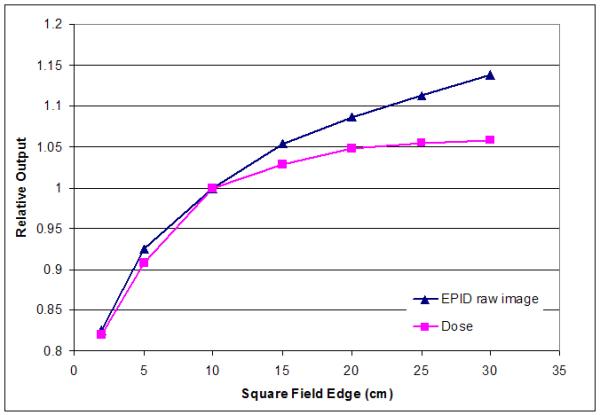
Fig. 2.

Field size response of one representative 6X EPID. In the second conversion step, the field size response variation is accounted for through software analysis of all MLC segments. The EPID image is then corrected for each exposed section and relative contribution of control points.
