Fig. 3.

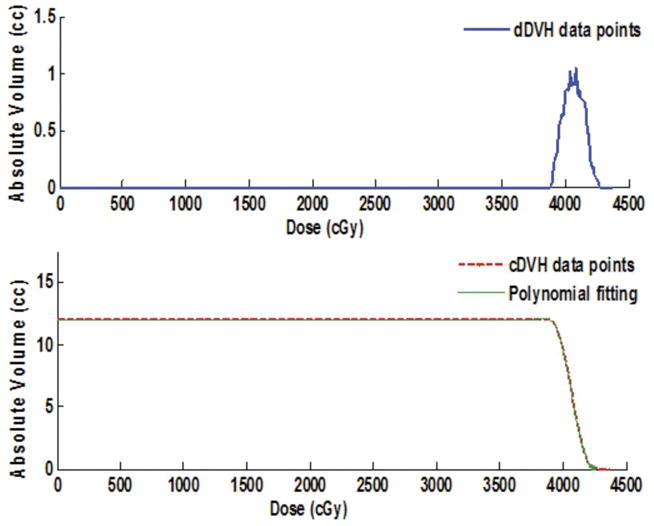
HART-based differential (top) and cumulative (bottom) dose-volume histograms (DVHs) simulation for a critical structure. The cumulative DVH includes an optimal polynomial approximation as shown by the dashed curve.

HART-based differential (top) and cumulative (bottom) dose-volume histograms (DVHs) simulation for a critical structure. The cumulative DVH includes an optimal polynomial approximation as shown by the dashed curve.