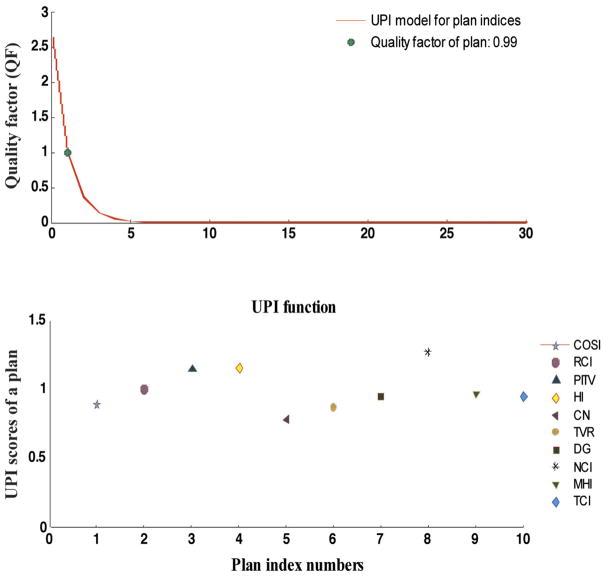
Fig. 6.
HART evaluated universal plan indices (UPI) scores utilizing ten UPI set of indices at equal relative weight (Wi = 0.10) for a prostate case treated with an IMRT boost technique. The UPI scores are presented in first simulation plot (bottom). The plot of quality factor (QF) against the UPI function is also presented as an UPI model for the given set of indices in second simulation (top). The computed value for the QF is specified in the legend of the plot. It determines the overall quality of a well designed treatment plan. Plan index numbers represent the specific number of plan indices for the identification purpose in the UPI set.

