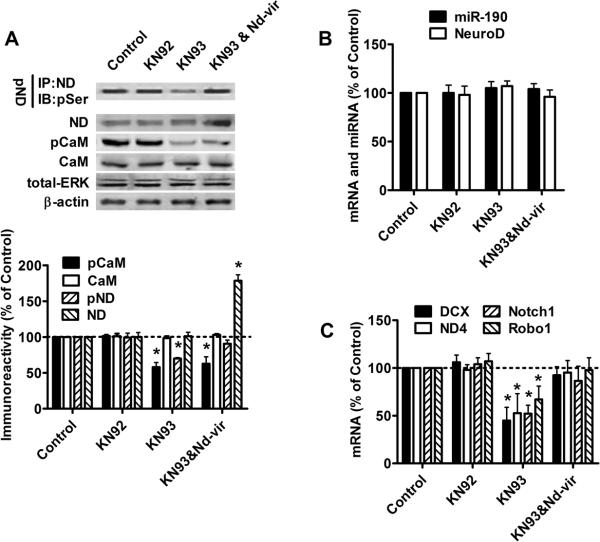
Fig. 3. NeuroD activity correlates with its phosphorylation by CaMKIIα.
Primary cultures were treated with PBS (control), KN92 (2μM), KN93 (2μM) or KN93 (2μM) & nd-vir for three days.
(A) The amount of phosphorylated NeuroD, total NeuroD, total CaMKIIα, phosphorylated CaMKIIα, total ERK and β-actin were determined as in Fig. 1A.
(B) The levels of miR-190 and NeuroD mRNA were measured by real-time PCR.
(C) The mRNA levels of DCX, ND4, Notch1 and Robo1 were determined with real-time PCR. The results (A–C) were normalized against those in control samples.

