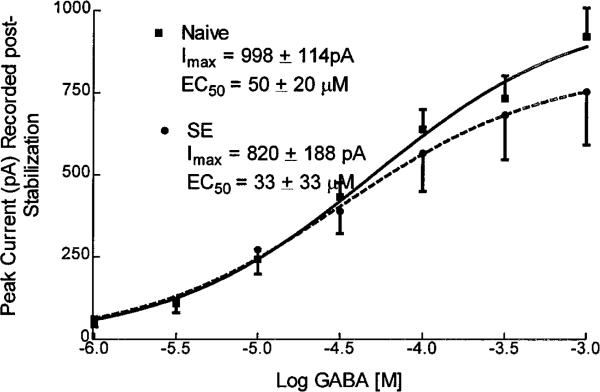
Figure 4.
GABA concentration dependency. GABA concentration and normalized GABAR peak current relationships were plotted for 17 neurons isolated from control animals and for 9 neurons isolated from animals undergoing status epilepticus. Concentration–response data were obtained after stabilization of currents. Each point represented the mean of normalized peak currents, and the error bars showed SEMs. The line was the best fit of data to a sigmoidal function. The EC50 and Imax were derived from the equation for the sigmoidal function that best fitted the data.

