
Figure 1. Representative RV short axis reformatted views in end-diastole (A and C) and end-systole (B and D) from the RV MSCT protocol comparing a patient with normal PA pressure (A and B) and a patient with PH (C and D).
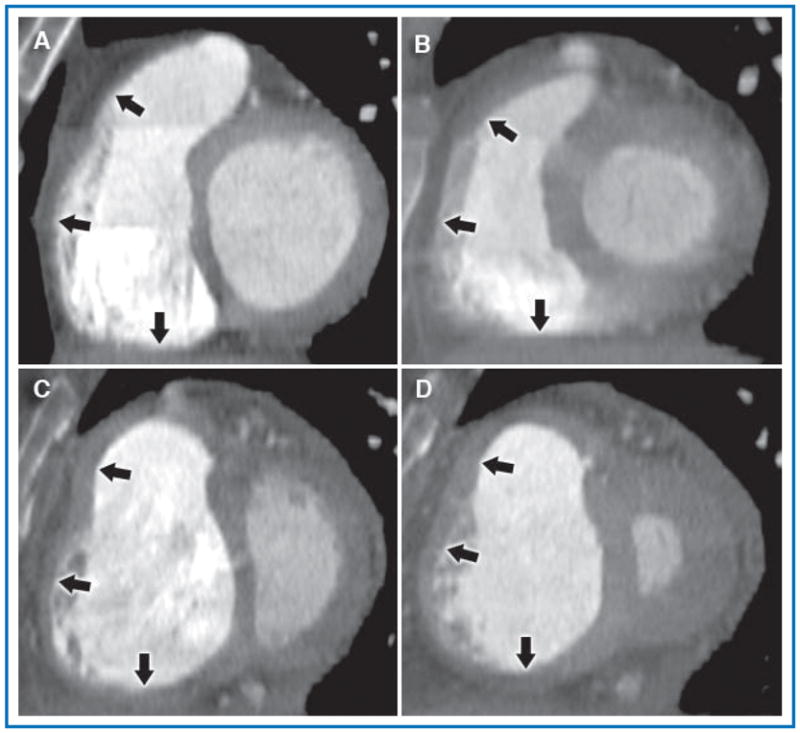
The normal patient had a calculated RV FAC = 0.72, RA pressure 4 mmHg, mean PA pressure 17 mmHg, and cardiac index 4.9 L/min. The patient depicted in the lower panels had severe idiopathic pulmonary arterial hypertension and had a calculated RV FAC = 0.18, RA pressure 10 mmHg, mean PA pressure 75 mmHg, and cardiac index 1.8 L/min. In both patients, the RV cavity is well opacified and borders are easily defined. In the PH patient, also note septal flattening and the dilated RV with hypertrophied free wall and prominent trabeculations, findings not seen in the normal patient. Arrows, top to bottom, indicate the three measured regions of the RV wall (infundibulum, free wall, and inferior wall, respectively).