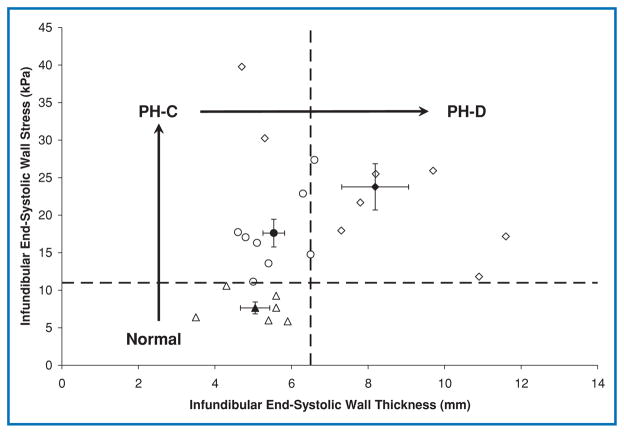
Figure 3. Infundibular wall stress versus wall thickness.
Open symbols represent individual patients; filled symbols represent group means with standard error bars. Normal indicates patients with normal pulmonary artery pressure; PH-C, pulmonary hypertension patients with hemodynamically compensated right ventricular function; PH-D, pulmonary hypertension patients with hemodynamically decompensated right ventricular function.

