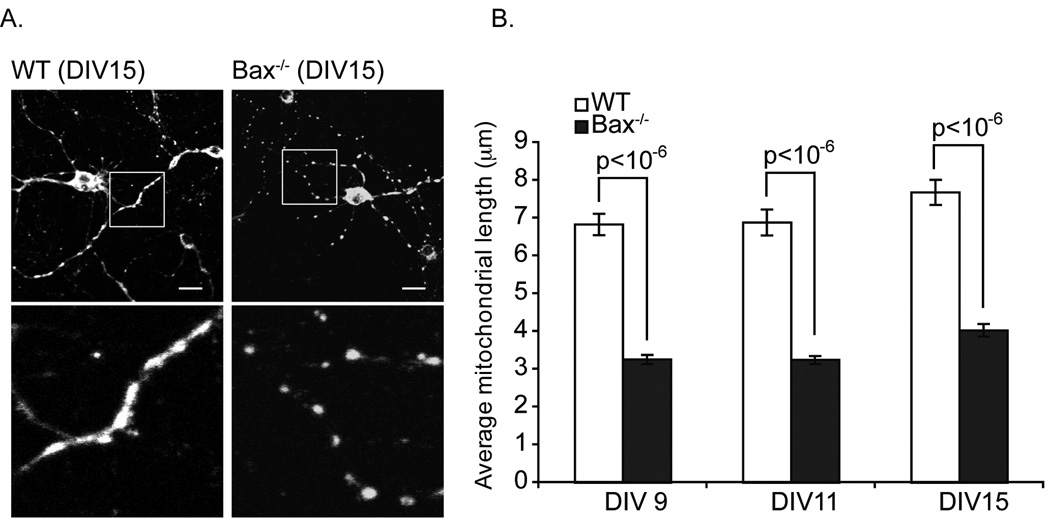
Figure 2. Mitochondrial morphology in WT and Bax−/− neurons.
(A) Representative images of cytochrome c stained mitochondria located within neuronal processes of C57BL/6 WT or Bax−/− mouse neurons analyzed at DIV 15. The scale bar represents 10 µm. (B) Mitochondria in WT and Bax−/− cortical neurons were isolated and grown in vitro for 9, 11 or 15 days (days in vitro, DIV) were measured using MetaMorph image analysis software. The average mitochondrial length (µm) ± SEM (n=225) is plotted for each cell type at each time point (DIV). p-values are noted in the figure. These data are representative of three independent experiments.

