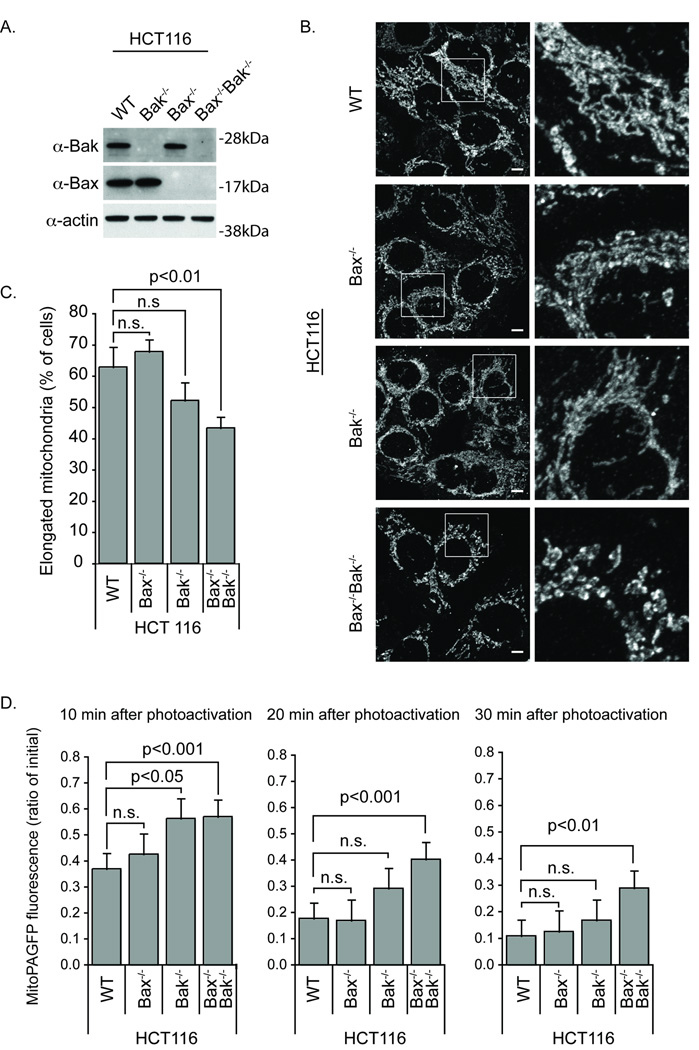
Figure 3. Mitochondrial morphology and fusion rate in wild type, Bax−/− and Bax−/− Bak−/− HCT116 cells.
(A) Western blot analysis of Bak and Bax protein levels in WT, Bax−/−, Bak−/− and Bax−/−Bak−/− HCT116 cells. (B) Representative images of cytochrome c immunostained mitochondria in WT, Bax−/−, Bak−/− and Bax−/− Bak−/− HCT116 cells. Scale bar represents 5 µm. (C) Quantification of mitochondrial morphology visualized using anti-cytochrome c antibody in WT, Bax−/−, Bak−/− and Bax−/−Bak−/− HCT116 cells. 100 cells total per cell type were quantified in a blinded manner, and the average number of cells with an elongated mitochondrial morphology was plotted ± SD. The difference between cell lines was significant via the student’s t-test. (D) Bax−/−Bak−/− HCT116 cells have slower rates of mitochondrial fusion. Mitochondrial fusion rates were analyzed in WT, Bax−/−, Bak−/− and Bax−/−Bak−/− HCT116 cells. The average ± SEM (n >20) fluorescence remaining over time was plotted. The data were analyzed using two-way ANOVA (Cell line variation F=13.73, p<0.001) followed by the Bonferroni posttest, and p-values are noted on the figure. These data are representative of at least two independent experiments.

