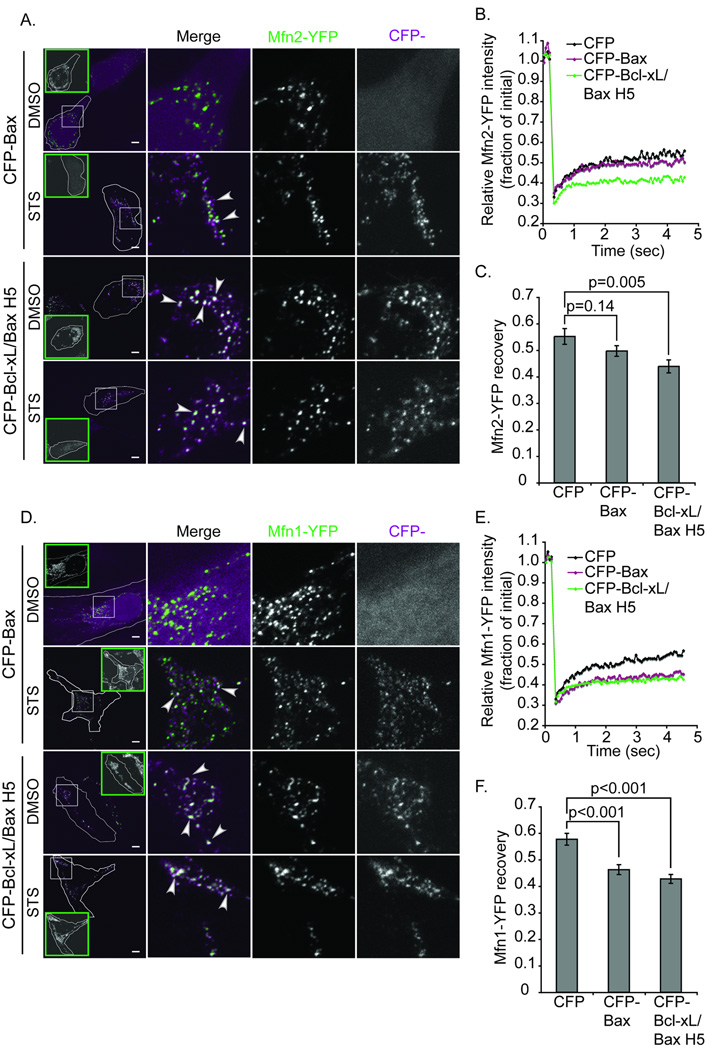
Figure 6. Bcl-xL/Bax H5 co-localizes with overexpressed Mfn1 and Mfn2 and decreases the mobility of Mfn1 and Mfn2 more efficiently than Bax.
(A, D) Mitofusin/Bcl-2 family colocalization was examined in HeLa cells transiently expressing Mfn2-YFP (A) or Mfn1-YFP (D) and CFP-Bax or CFP-Bcl-xL/Bax H5 and treated with 10µM QVD and 1µM STS or DMSO for 90min. Green inset boxes show cytochrome c staining of the outlined cell thus representing cytochrome c release in most STS treated cells (the CFP-Bax STS sample in Figure 6D shows partial cytochrome c release, while the CFP-Bcl-xL/Bax H5 STS sample in Figure 6D shows intact cytochrome c). White boxes show areas of the cells used for the higher magnification merge image. Arrowheads denote some of the white regions of colocalization. Scale bar denotes 5µm. (B–C, E–F) Mitofusin protein mobility was assessed by FRAP in HeLa cells transiently transfected with Mfn2-YFP (B–C) or Mfn1-YFP (E–F) and CFP, CFP-Bax or CFP-Bcl-xL/BaxH5. (B, E) Average curves from 30 individual ROIs per condition. (C, F) Average ± SEM of the final recovery of 30 individual regions. The p-value was obtained using student’s t-test. These data are representative of at least two independent experiments.

