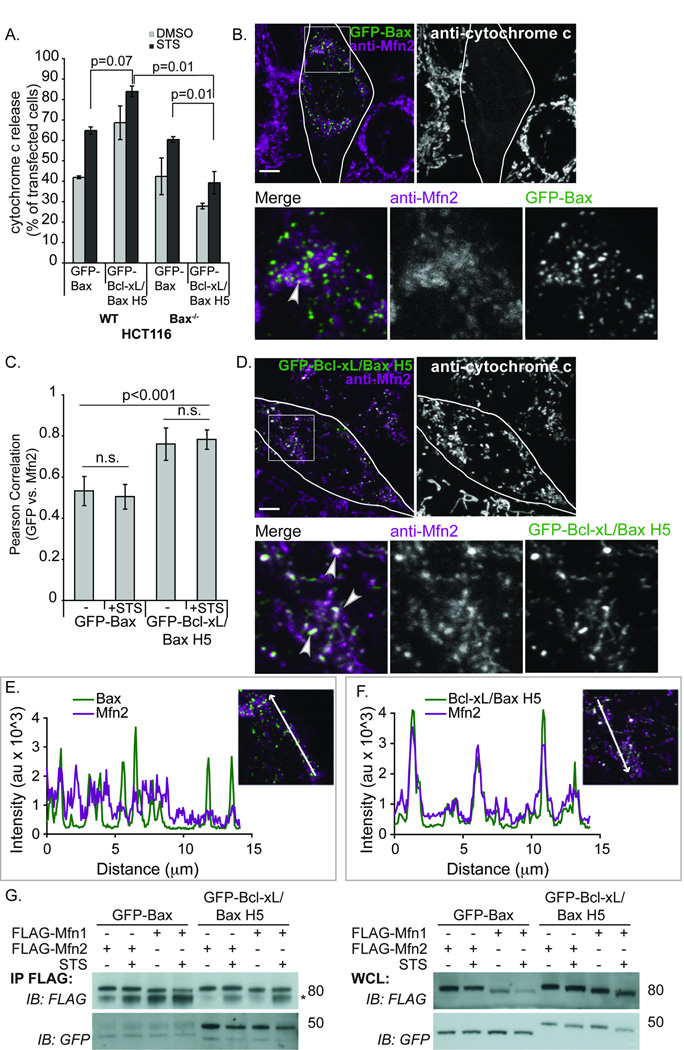
Figure 7. Bcl-xL/Bax H5 co-localizes with endogenous Mfn2 more efficiently than Bax.
(A) WT HCT116 or Bax−/− HCT116 cells were transfected with GFP-Bax or GFP-Bcl-xL/Bax H5, treated with 10µM QVD and 1µM STS or DMSO for 4hr and immunostained for cytochrome c. 100 cells were counted in triplicate, analyzing the percentage of cells releasing cytochrome c. P-values were calculated using the students t-test. (B–F) Bax−/− HCT116 cells were treated with the 10 µM QVD, transfected with GFP-Bax (B, C, E) or GFP-Bcl-xL/Bax H5 (C, D, F), immunostained for cytochrome c and endogenous Mfn2. White areas designate co-localization or merged regions (represented by arrowheads). Scale bar denotes 5µm. (C) HCT116 Bax−/− cells were prepared as above and treated for 2 hr with 1µM STS or DMSO (−). At least 20 cells per condition were imaged and analyzed using the Volocity program to calculate the Pearson Correlation value (co-localization) between Mfn2 and GFP-Bax or GFP-Bcl-xL/Bax H5. The p-values were obtained using student’s t-test. (E, F) Line scan plots of the images shown in 7B and 7D, respectively were analyzed for co-localization of GFP and Mfn2 signals using the LSM 510 program. (G) Bax−/− HCT116 cells were transfected with FLAG-Mfn1 or FLAG-Mfn2 and GFP-Bax or GFP-Bcl-xL/Bax H5. Following treatment for 4 hr with 1µM STS or DMSO, the cells were collected, immunoprecipitated with FLAG beads and blotted for FLAG and GFP. These data are representative of at least two independent experiments.

