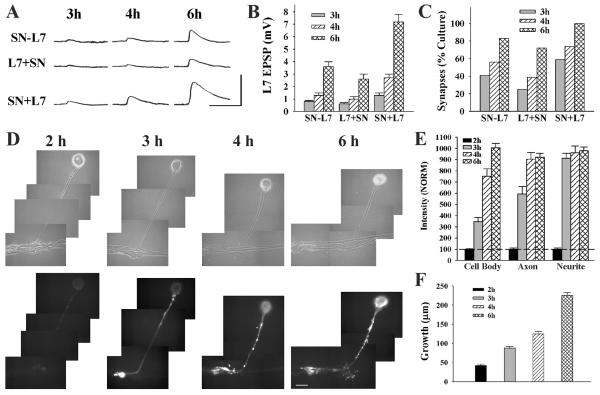
FIGURE 1.
Time course for synapse formation, sensorin expression, and axon growth of sensory neurons when interacting with L7. A-C, Time course for synapse formation. EPSPs evoked in L7 at 3 - 6 h of interaction for the three types of cell culture: simultaneous plating (SN-L7), L7 first then sensory neuron added the next day (L7 + SN) and sensory neuron first and L7 added the next day (SN + L7). EPSP amplitudes increased with time (A). The vertical bar is 10 mV, horizontal bar is 25 msec. Plating sensory neuron first leads to stronger synapses (B) and higher proportion of cultures with detectable synapses (C). In B the height of each bar is the Mean ± SEM of EPSP amplitude at each time point for the three culture conditions. ANOVA indicated a significant difference with condition and time (df = 4, 36; F = 4.032, p < 0.02). Individual comparisons (Scheffe F) indicated that EPSP amplitude for SN + L7 cultures were significantly greater than the amplitudes in the other two culture conditions at each time point (p < 0.05 at 3 h and p < 0.01 at both 4 h and 6 h). Besides EPSP amplitudes, the proportion of cultures with synapses was higher for SN + L7 cultures (C). D-E. Sensorin expression in each cellular compartment increases over time for SN-L7 cultures. Phase contrast and corresponding epifluorescent images for sensorin immunostaining depict changes in sensorin expression at the various time points (D). Sensorin expression is low at 2 h (n = 6) but increases significantly at distal sites by 3 h (n = 8). At 4 h (n = 8), sensorin staining peaked in the axon, while peak intensity in the cell body occurred at 6 h (n = 10). The bar equals 50 μm. In E the height of each bar is the Mean ± SEM staining intensity for sensorin in each compartment at each time point after normalizing to the 2 h intensity values for each compartment (100% ± SEM). The peak intensity is first achieved in the distal neurites, while the peak intensity in the cell body is achieved last. ANOVA indicated a difference with time in each compartment (df = 2, 28, F = 78.785, p < 0.001). Individual comparisons indicated that staining intensity in the cell body increased with each time point (p < 0.01), staining intensity in the axon increased at each time point (p < 0.01) up to 4 h, and staining intensity in the distal neurites increased at 3 h (p < 0.01) and remained relatively constant afterwards. F. Axon growth by sensory neurons increased continuously from 2 h to 6 h. Height of each bar is the Mean ± SEM extent of sensory neuron axon growth in contact with the major processes of L7 based on detectable sensorin immunochemistry in the distal neurites.

