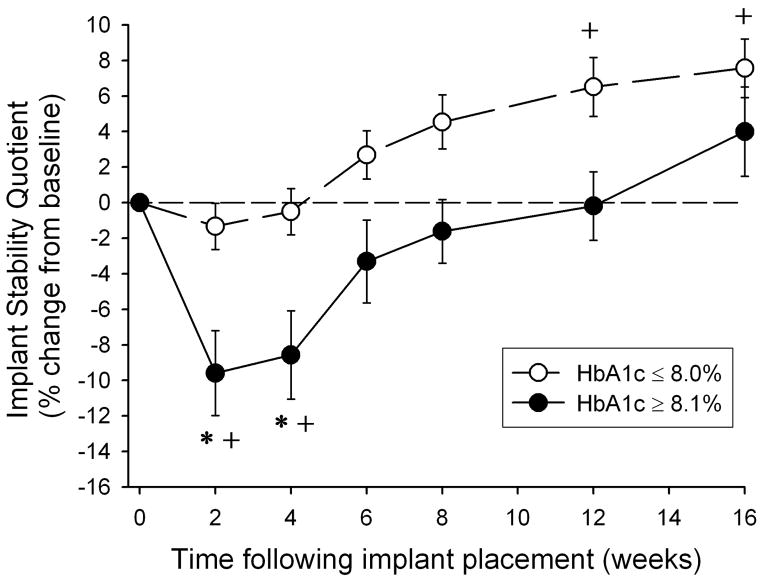
Figure 2.
Changes in Implant Stability Quotient (%) from baseline by HbA1c level and time following implant placement. ○ HbA1c ≤ 8.0% (n=22 patients), ● HbA1c≥ 8.1% (n=10 patients). Error bars represent SE. ‘*’ indicates HbA1c ≥ 8.1% significantly (p≤0.05) different from HbA1c ≤ 8.0% at same follow-up time. ‘+’ indicates significant (p≤0.05) change from baseline for same HbA1c group.

