
Figure 6.
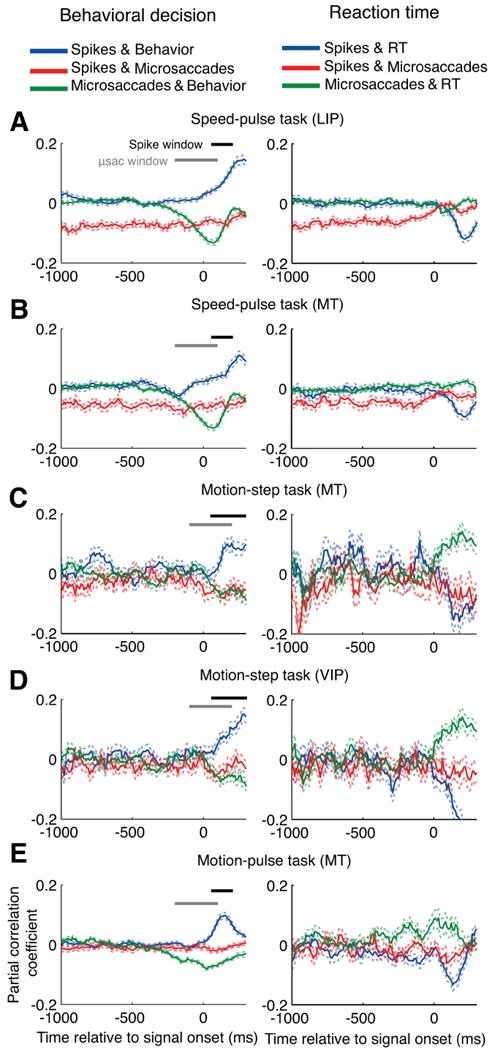
The partial correlations between microsaccades, neural activity, and perception. The partial correlation analysis was performed at 10 ms intervals relative to stimulus onset and averaged across all neurons for each condition. Perception was measured as either the behavioral response (correct = 1, failed = 0, shown in the left column), or the reaction time for correct trials (right column). The blue curve shows the partial correlation between neural activity and perception with the effects of microsaccades removed. The red curve shows the partial correlation between neural activity and microsaccades with the effect of perception removed. The green curve shows the partial correlation between microsaccades and perception with the effect of neural activity removed. The neural activity was the number of spikes in the previous 100 ms and the number of microsaccades from 100 to 200 ms before each point was used in the calculation. The horizontal black and gray bars give the windows used to count spikes and microsaccades, respectively, for Figure 7. A, Speed-pulse in LIP; B, speed-pulse in MT; C, motion-step in MT; D, motion-step in VIP; E, 50 ms motion-pulse in MT. Dashed lines show ± 1 SE. μsac, Microsaccades.