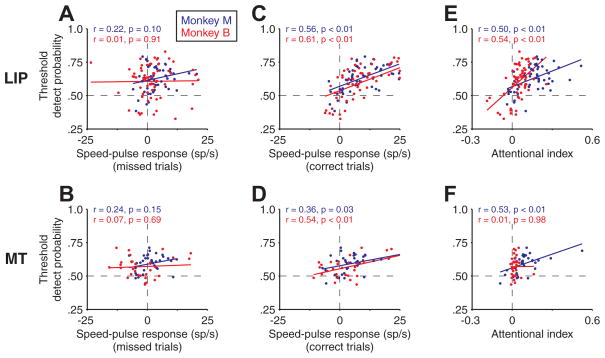
Figure 13.
Correlations between the speed-pulse response, threshold detect probability, and magnitude of attentional modulation. Data are shown separately for area LIP (A, C, E) and area MT (B, D, F ) from monkey M (blue) and monkey B (red). A, B, Neural response on missed trials after a speed pulse versus threshold detect probability from Figure 8. Speed-pulse response was the average neural activity 100 –300 ms after the pulse minus a prepulse baseline taken from −200 to 0 ms. C, D, As in A and D but using the speed-pulse response on correct trials versus the threshold detect probability. E, F, Attentional index versus threshold detect probability. Inset values show the correlation coefficient (r) and p value (F test for slope = 0).

