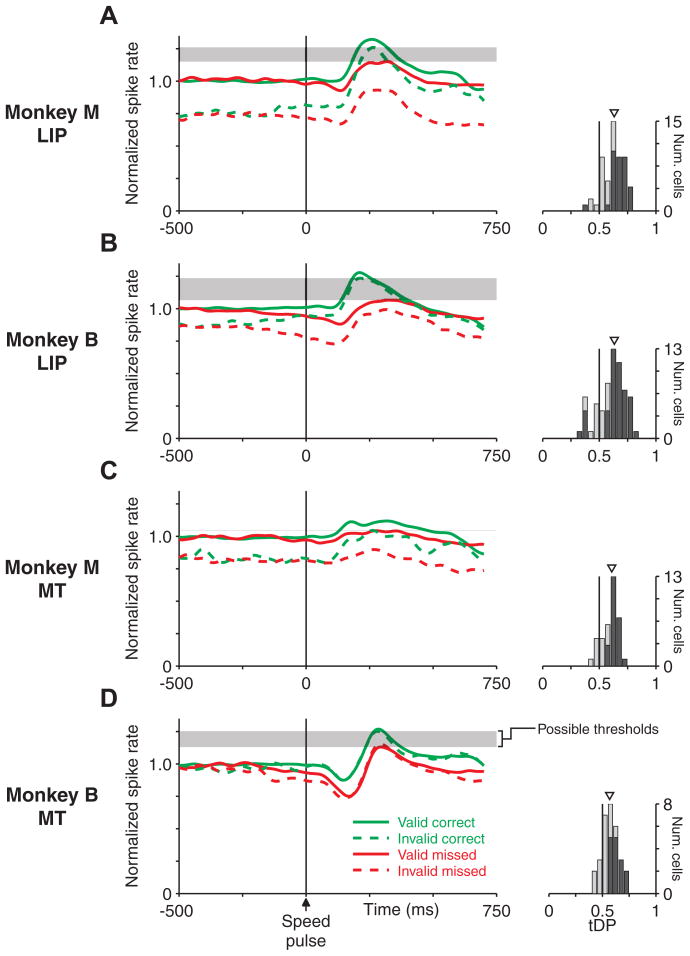
Figure 8.
A threshold model can distinguish correct and missed trials using LIP or MT population responses. A–D, Left panels show the normalized population average spike rate aligned on the time of the speed pulse for LIP (A, B) and MT (C, D), shown separately for monkey M (A, C) and monkey B (B, D). Individual trials were normalized before averaging such that the prepulse spike rate for cued trials (correct plus missed) was equal to 1 (see Materials and Methods). Responses are split based on whether the speed pulse was at the cued location (i.e., valid-cue trials, solid lines) or uncued location (i.e., invalid-cue trials, dashed lines) and by whether the monkey correctly detected (green) or missed (red) the speed pulse on that trial. The average peak response to the speed pulse was larger on trials in which the speed pulse was correctly detected, independent of whether the speed-pulse location was cued. The horizontal shaded regions mark the range of response thresholds separating the responses of correct and missed trials. Each area had such a range, although the range was very narrow for area MT in monkey M (C). Histograms to the right show the distribution of tDP for individual neurons (see Materials and Methods). This metric tested the ability of a simple spike-rate threshold to distinguish single-trial neural responses between correct and missed trials. Values are consistently above 0.5, which corresponds to greater peak responses on correct than missed trials. Neurons with statistically significant tDP are shown as dark bars (neurons: monkey M, LIP, 34 of 55; MT, 24 of 36; monkey B, LIP, 47 of 63; MT, 15 of 31; p < 0.05, permutation test). Triangles mark the median value across each population.

