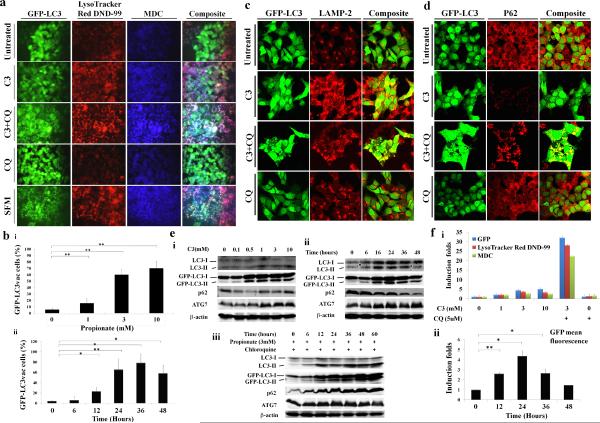
Figure 1. Induction of autophagy by propionate in colon cancer cells.
(a) A bulk population of HCT116 cells with stable GFP-LC3 expression was treated with propionate (C3, 3mM) for 36 hours or was starved within serum free medium (positive control) for 24 hours. Cell culture medium was changed daily. Formation of acidic vesicular organelles was monitored by LysoTracker DND-99 or MDC staining. Chloroquine (CQ) (5uM) was added to increase the accumulation of autophagosomes. Representative images of cells were taken with a fluorescence microscope at 600× magnification. Note the pink color in a composite panel, which stands for the colocalization of pucutate GFP-LC3, LysoTracker DND-99 and MDC staining.
(b) Quantification of the percentage of cells with more than 8 GFP-LC3 puncta per cell is represented as “GFP-LC3vac cells (%)”. GFP-LC3 expressing cells were treated with indicated concentrations of propionate for 36 hours (i). The percentage of cells with punctate GFP-LC3 caused by 3mM propionate was monitored at different time points (ii). A minimum of 100 GFP-LC3 expressing cells were counted. *P <0.01; ** P<0.001, compared with PBS control at the corresponsding time.
HCT116 cells were treated with propionate (3mM) in the presence or absence of CQ (5uM) for 24 hours. The cells were stained with LAMP-2 antibody (c) or p62 antibody (d). Representative images of cells were taken with an Olympus Fluoview confocal microscope using a 60× oil immersion objective lens.
(e) HCT116 cells with stable GFP-LC3 expression were subjected to propionate at different concentrations (i) or propionate (3mM) for the indicated times (ii). The cell lysates were immunoblotted against several autophagy markers. Autophagy markers were also examined in the cells treated with propionate in the presence of CQ (5uM) (iii).
(f) Increased acidic vesicular organelle formation was reflected by elevated punctate LysoTracker staining and increased MDC incorporation in HCT116 cells after propionate treatment. HCT116 cells were subjected to propionate at different concentrations (i) or propionate (3mM) for the indicated times (ii). The cells were stained with the dyes and subjected to flow cytometry analysis. The bars represent the mean ± SE (n=4). *P <0.01; ** P<0.001, compared with PBS control at the corresponsding time.

