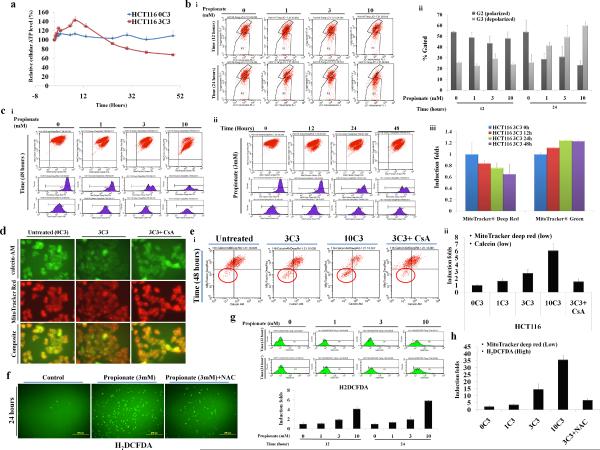
Figure 4. Propionate-induced AMPK signaling activation is associated with mitochondrial defect-induced cellular ATP depletion and oxidative stress.
(a) HCT116 cells were treated with propionate (3mM) for the indicated times. The intracellular ATP level was measured using a CellTiter-Glo® Luminescent Cell Viability Assay kit. The bars represent the mean ± SE (n=4).
(b) HCT116 cells were treated with propionate (0, 1, 3, 10 mM) for the indicated times and were stained against JC-1 for flow cytometry. There was a significant increase in the number of cells with lowered red fluorescence [FL-2 (R3)], indicating a change in the Δψ (i). The percentage of cells with polarized versus depolarized Δψ was presented as bar graph (ii). The bars represent the mean ± SE (n=3).
(c) Mitochondria were stained with MitoTracker Deep Red and MitoTracker Green FM simultaneously, and the staining intensities were determined by flow cytometry (i and ii), with the mean fluorescence presented in the bar graph (iii). The bars represent the mean ± SE (n=3).
(d) HCT116 cells were treated with propionate (3mM) in the absence or presence of cyclosporin A (CsA, 2 uM) for 24 hours. Then the cells were stained with calcein-AM, CoCl2 and MitoTracker® Red. Representative images were obtained by fluorescence microscopy. Magnification, X600.
(e) Propionate treated cells were stained with MitoTracker Deep Red and calcein-AM. The dyes intensities were analyzed by flowcytometry (i) and were presented as bar graph (ii). The bars represent the mean ± SE (n=3).
(f) HCT116 cells were treated with propionate (3mM) in the presence or absence of N-acetylcysteine (NAC) (1mM) for 24 hours and the cells were stained with Carboxy-H2DCFDA for reactive oxygen species (ROS) detection and representative images were obtained by fluorescence microscopy. Magnification, X100.
(g) Carboxy-DCF fluorescence was analyzed by flowcytometry.
(h) HCT116 cells were treated with propionate (0, 1, 3, 10 mM) for 48 hours. The cells were stained with Carboxy-H2DCFDA and MitoTracker Deep Red. The fluorescence intensities were analyzed by flow cytometry. The percentage of cells with enhanced Carboxy-H2DCFDA and reduced MitoTracker Deep Red staining were presented as bar graph. The bars represent the mean ± SE (n=3).

