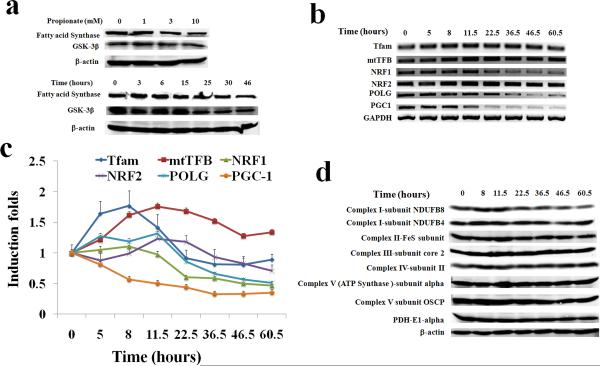
Figure 6. Rescue of cellular energy crisis through mitochondria biogenesis and alteration of glycogen and lipid metabolic pathways.
(a) HCT116 cells were treated with propionate at different concentrations for 24 hours (top) or with 3mM propionate for the indicated times (bottom). The expression level of fatty acid synthase and GSK-3β was determined by Western blot. The expression profile of genes regulating mitochondrial biogenesis in HCT116 cells after propionate treatment was evaluated by both semiquantitative reverse transcriptase PCR (RT-PCR) (b) and Real-time PCR (c). The bars represent the mean ± SE (n=4). Nuclear gene mitochondrial transcription factor A (Tfam); mitochondrial transcription factor B (mtTFB); nuclear respiratory factors-1 and -2 (NRF-1 and -2); DNA polymerase gamma (Pol-γ); and peroxisome proliferator activated receptorγ co-activator 1 (PGC-1). (d) The protein level of mitochondrial redox carriers' subunits was examined by Western blot.

