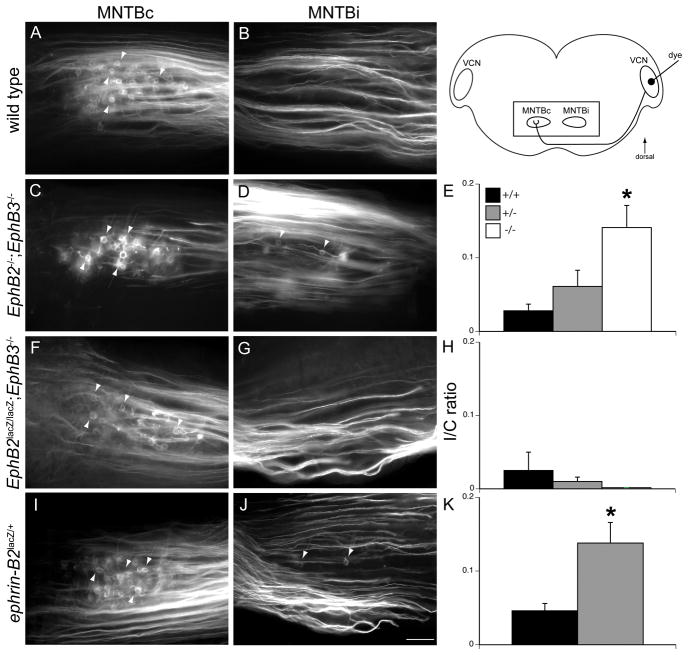
Figure 2. Effects of EphB2, EphB3 and ephrin-B2 mutations on axonal projections from VCN to MNTB.
The schematic diagram shows the orientation of brainstem sections and dye labeling protocol. For all panels in this figure, dye originates on the right side of the image, in the VCN outside the field of view. The rectangle indicates the portion of the section in which labeling will be evaluated. Labeling in fixed tissue was performed at P10–14 in wild type and transgenic mice. A. In wild type mice, dye labeling of VCN results in labeled calyces in MNTBc. Arrows indicate some of the labeled calyceal terminations. B. No aberrant projections are seen in MNTBi. C. In EphB2−/−;EphB3−/− mice, VCN-MNTBc projections are normal and terminate in identifiable calyces (arrows). D. However, there are also abnormal VCN projections to MNTBi that terminate in calyx-like morphology (arrows). E. A ratio of the number of ipsilateral calyces to the number of contralateral calyces (I/C ratio) reveals that EphB2−/−;EphB3−/−mice have significantly more aberrant projections (*) than EphB2+/+;EphB3−/− or EphB2+/−;EphB3−/− mice. F. In EphB2lacZ/lacZ;EphB3−/− mice, VCN-MNTBc projections are normal and terminate in identifiable calyces (arrows). G. No aberrant projections are seen in MNTBi. H. There are no significant differences in I/C ratios for EphB2+/+;EphB3−/−, EphB2lacZ/+;EphB3−/− and EphB2lacZ/lacZ;EphB3−/− mice. I. In ephrin-B2lacZ/+mice, VCN-MNTBc projections appear normal and terminate in identifiable calyces (arrows). J. However, there are aberrant projections from VCN to MNTBi (arrows). K. I/C ratios reveal significantly more aberrant projections (*) in ephrin-B2lacZ/+ than ephrin-B2+/+mice. Asterisks indicate p values < 0.05. Scale bar in J also applies to A–D, F–G and I and indicates 50 μm.

