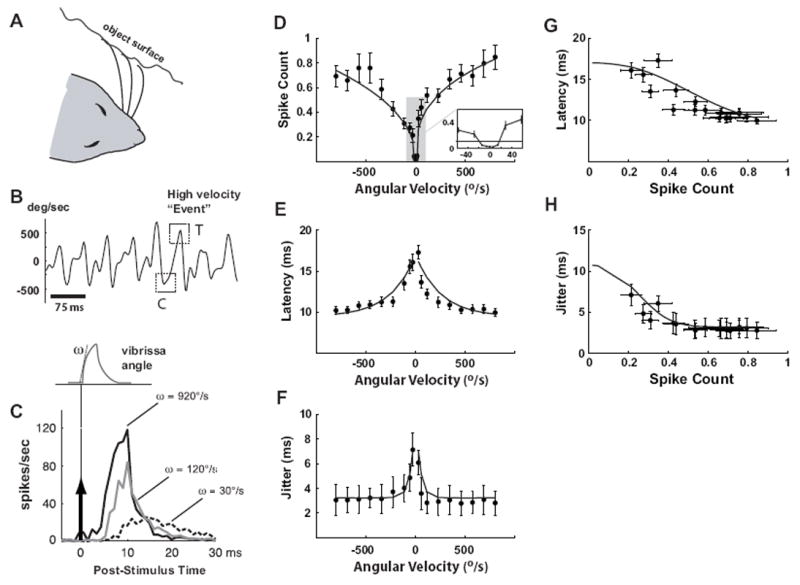
Figure 1. Responses of SI neurons systematically vary with vibrissa velocity.

A. Illustration of vibrissa contact with surface during active exploration. B. Measured angular velocity during locomotion on linear track lined with coarse grating textures. Example high-velocity “events” are highlighted with dashed squares. C. The schematic shows the shape of the idealized deflection pulse presented, whereby the angular velocity is changed by varying the onset slope ω. All pulses were presented 60 times at a 1 Hz repetition rate. The traces on the right show the average firing rate responses to three angular velocities (dashed black: 30°/sec, gray: 120°sec, solid black: 920°/sec). The stimulus was presented at time zero. D-H. Relationships between various spiking response properties and the angular velocity of the punctate vibrissa deflection. All error bars in these plots represent ±1 SEM (Standard Error in the Mean). All curves are parametric fits, as described in the Methods. D. For each stimulus velocity, the average number of spikes per presentation (spike count) was computed by summing the evoked PSTH over the 3-30 ms time window (n = 44 cells). E. Variation of mean response latency with velocity. F. Variation of response timing jitter with angular velocity. G.. Latency as a function of spike count. H. Timing jitter as a function of spike count.
