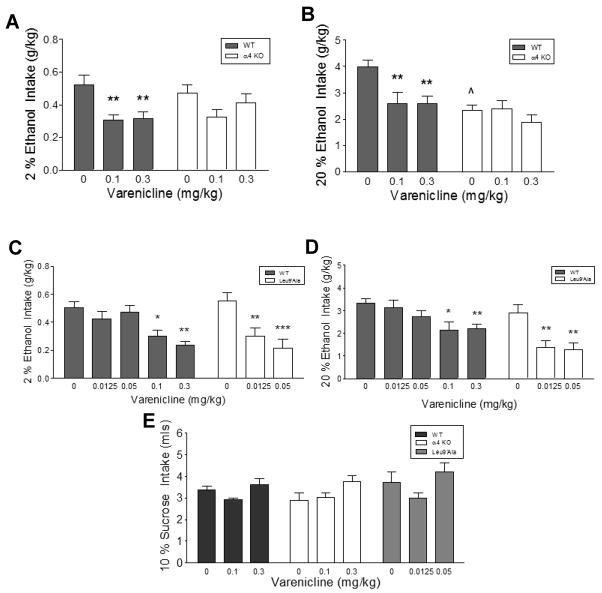
Figure 3.
Alcohol intake after varenciline treatment in α4 KO, Leu9′Ala and WT mice. A. 2 % ethanol intake in WT and α4 KO mice after saline or varenicline treatment (n = 8–9/genotype). B. 20 % ethanol intake in WT and α4 KO mice after saline or varenicline treatment (n = 10–12/genotype). C. Effect of saline and varenicline on 2 % ethanol intake in WT and Leu9′Ala (n = 10–11/genotype). D. Effect of saline and varenicline on 20 % ethanol intake in Leu9′Ala and Leu9′Ala WT mice (n = 6–9/genotype). E. Effect of varenicline treatment on 10 % sucrose intake (n = 5–11/genotype) in WT, α4 KO, and Leu9′Ala mice. * p < 0.05, ** p < 0.01, ^ p < 0.01 (α4 KO compared to WT after saline injection)

