Figure 2.
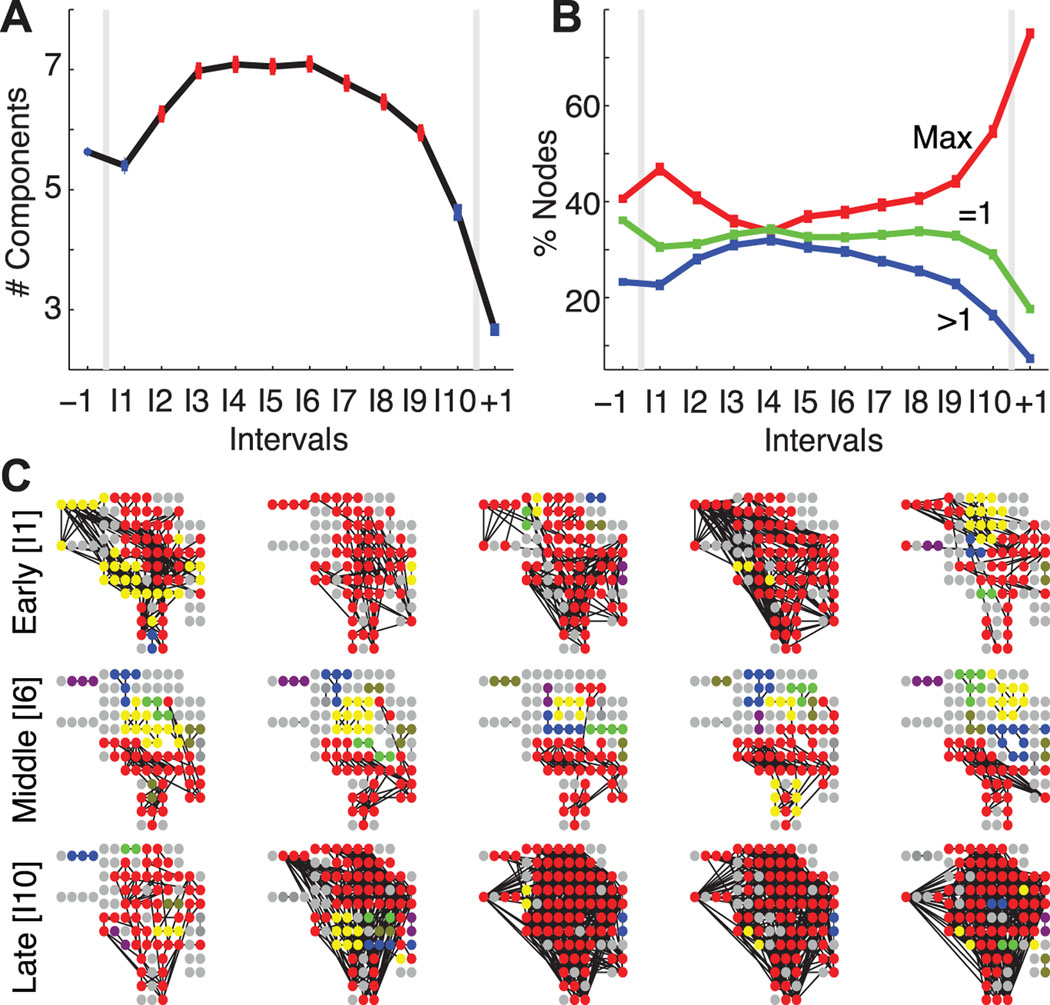
The largest network components fracture during the seizure. (A) The average number of connected components (adjusted for differences in subjects) increases during the course of a seizure; points plotted in red indicate a statistically significant increase from the preictal value (number of networks per interval same as in Figure 1, see Methods). (B) The average percentage of nodes in the largest connected component (red, Max label), in trivial components (green, =1 label), and in other connected components (blue, >1 label) for the population of subjects and adjusted for differences in subjects. After ictal onset, nodes leave the largest component and become isolated or join other connected components. (C) Examples of connected components during early ictal (top row), middle ictal (middle row), and late ictal (bottom row) intervals for a single subject and seizure. Each circle indicates an electrode (including both those on the cortical surface or subcortical) oriented to match surgical placement, and each black line indicates an edge. The electrode colors signify components — all electrodes of the same color belong to the same component, red denotes the largest component, and gray denotes single (isolated) electrodes. During the middle seizure interval, the largest component shrinks as more non-trivial components appear compared to the early and late ictal intervals.

