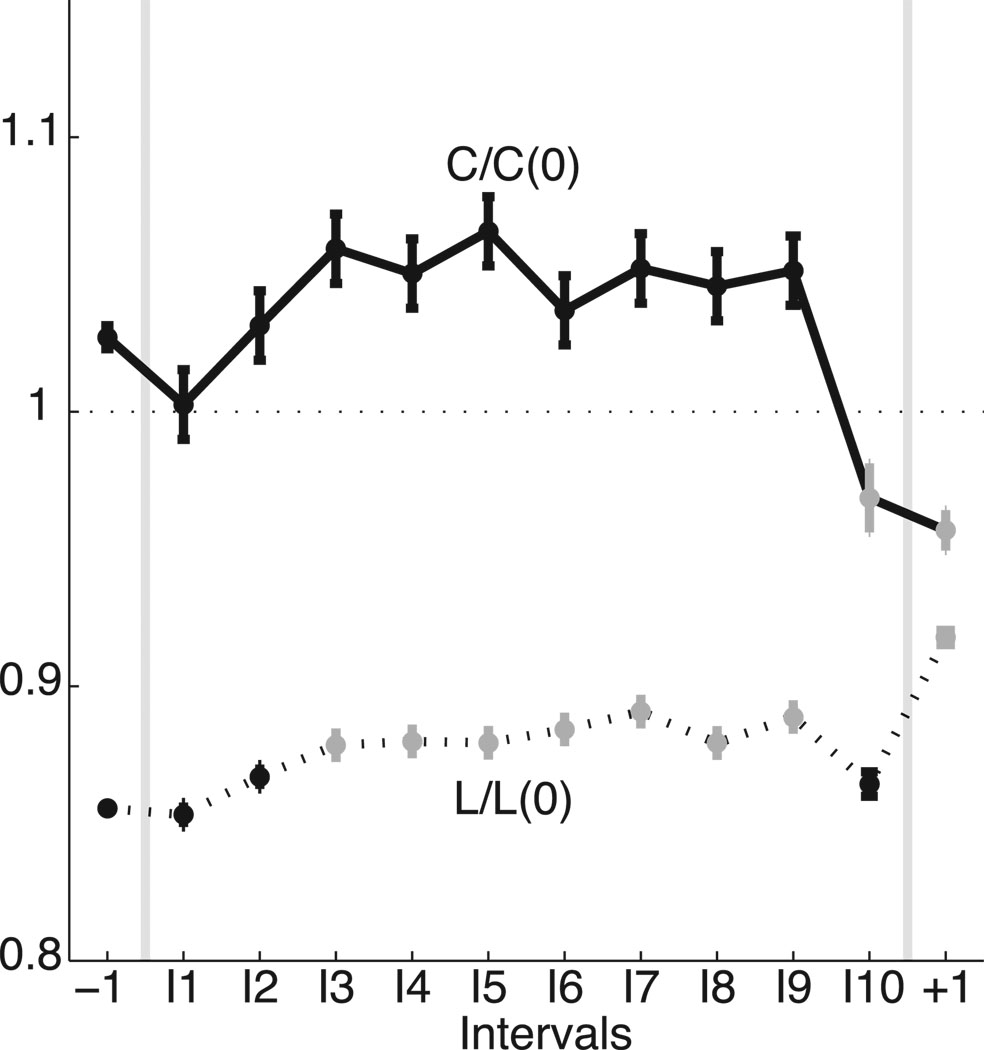
Figure 3.
The topological properties of the dominant subnetwork evolve during the seizure. We plot the scaled characteristic path length [L/L(0), dashed curve] and scaled clustering coefficient [C/C(0), solid curve] for each interval (adjusted for differences in subjects and with the same number of networks per interval as in Figure 1). Values that increase or decrease significantly from the preictal level are indicated in gray. For all intervals considered, the networks are approximately small-world. During the seizure, both measures tend to increase and the networks therefore become more regular. Just before seizure termination (interval I10), both measures decrease and the networks acquire a more random configuration.

