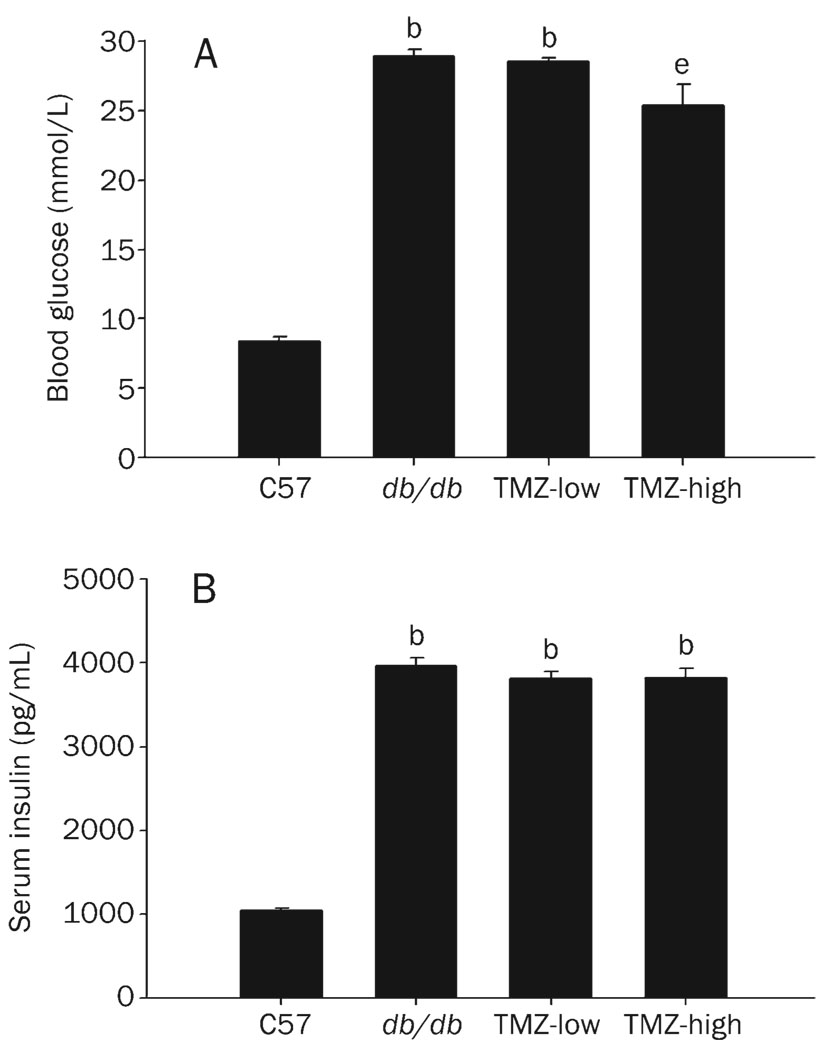
Figure 2. Blood glucose and serum insulin levels.
(A) Blood glucose was determined using ONE-TOUCH test strips in C57, db/db, TMZ-low, and TMZ-high mice. (B) Serum insulin was measured by ELISA. Values represent means from at least five animals in each group. Vertical bars indicate the standard error of the mean (SEM). bP<0.05 compared to the C57 control group; eP<0.05 compared to the db/db group.

