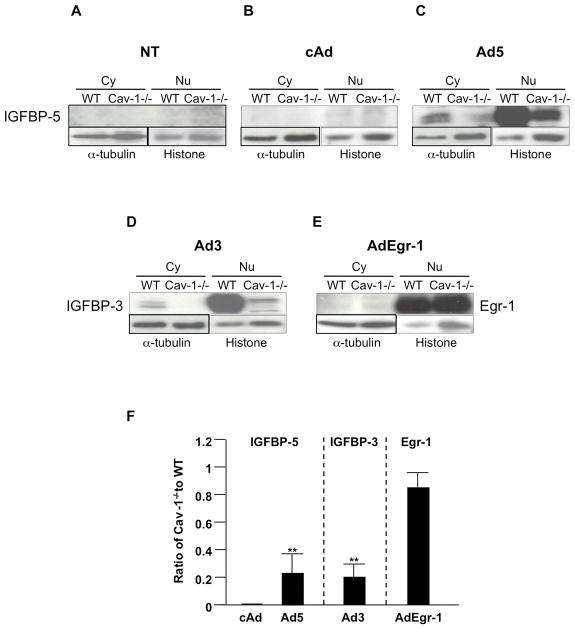
Figure 4.
IGFBP-5 (A–C), IGFBP-3 (D), and Egr-1 (E) levels in cytoplasmic and nuclear extracts from WT and Cav-1−/− fibroblasts. Cytoplasmic and nuclear fractions were extracted from WT and Cav-1−/− fibroblasts that were untreated or infected with the indicated adenoviral constructs for 48 h. Cytoplasmic and nuclear extracts were subjected to immunoblotting for the detection of IGFBP-5, IGFBP-3, and Egr-1. Alpha-tubulin is shown as a loading control for cytoplasmic extracts, and histone for nuclear extracts. F: Graphical summary of data is shown in panels B–E. The signal intensity of each protein in nuclear extracts was normalized to histone, and the ratio of the intensity in Cav-1−/− to WT was calculated. Differences in levels between WT and Cav-1−/− cells were compared using the unpaired t-test. Horizontal bars indicate mean values of 2 independent experiments. ** P < 0.01.

