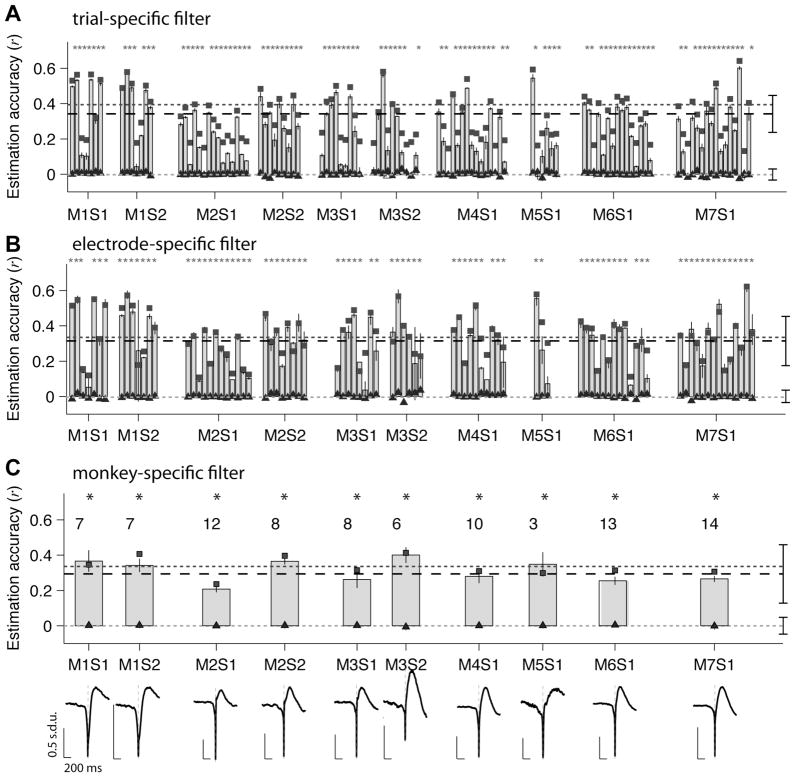
Figure 3. Linear estimation of LFPs for all electrodes.
(A) LFP time course estimations based on “trial-specific” W-K filters (see text and Figure 1A). Each 4-minute trial was split into two segments: one of these was used to build the W-K filter and the other segment was used to compute the LFP estimate. Each vertical bar reports the mean estimation accuracy (labeled “r” throughout the text) for all test trials in one electrode and error bars represent one SEM (5 “trials”). The data are blocked according to recording session (S) and monkey (M). The black squares represent the mean reconstruction accuracy obtained when the same data were used to compute the filter and reconstruct the LFP (see Methods). The triangles indicate the estimation accuracy obtained under the null hypothesis using random spike trains with the same firing rates (see Section 2.4). The “*” indicates statistical significance (p<0.01) based on a two-tailed t-test comparing the estimation accuracies against the null hypothesis. The dashed line indicates the average estimation accuracy (r̄) across all electrodes and all monkeys (r̄ = 0.36±0.15, n=109). The dark gray dotted line indicates the average reconstruction accuracy (average of the black squares, (r̄ = 0.39±0.12, n=109)). The light gray dotted line indicates the average estimation accuracy under the null hypothesis (average of the triangles, r̄ rand = 0.001±0.035, n=109).
(B) LFP time-course estimations based on “electrode-specific” W-K filters (see text and Figure 1B). For each electrode, half of the trials were used to compute the W-K filter and the spike trains in the remaining trials were used to estimate the LFP (Figure 1B). Each bar shows the estimation accuracy for a different electrode averaged over the trials used to estimate the LFP (error bars denote one SEM). The conventions are the same as in part (A). Only those electrodes with firing rate >5 spikes/s and CV>1 are shown here and in subsequent figures (n=88 electrodes out of the total of 109 electrodes; see Figure S4).
(C) LFP time course estimations based on “monkey-specific” filters (see text and Figure 1C). For each monkey, the data from half of the electrodes were used to compute the W-K filter and the spike trains from the remaining electrodes were used to estimate the LFP. For each recording session, here we show the average estimation accuracy across all the electrodes used to estimate the LFP (error bars denote one SEM). The conventions are the same as in part (A). The number of electrodes recorded in each session is indicated above each bar. The monkey-specific W-K filters are shown for each recording session.

