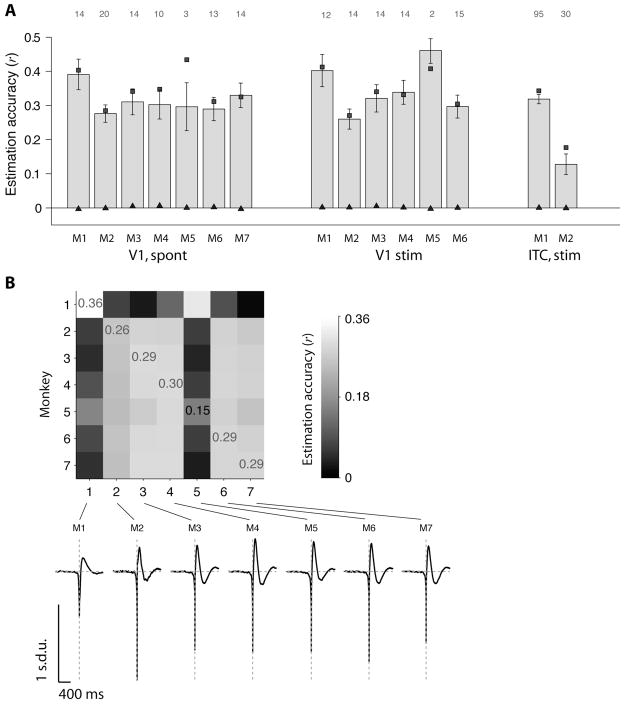
Figure 4. Linear estimation of LFPs across monkeys, stimuli and locations.
(A) Average estimation accuracies for all electrodes in V1 under spontaneous activity in 7 monkeys (left), all electrodes in V1 during visual stimulation in 6 monkeys (middle) and all electrodes in inferior temporal cortex (ITC) during visual stimulation in 2 monkeys (right). The V1 visual stimulation consisted of natural movies (see Methods). The ITC visual stimulation consisted of static grayscale images presented for 100 ms during passive viewing (Kreiman et al., 2006). Each bar indicates the mean estimation accuracy averaged over all the electrodes in each monkey (using “electrode-specific” filters; see Figure 1B). The error bars denote one SEM. The number of electrodes averaged in each case is indicated above each column. The conventions are the same as in Figure 3; the squares indicate the reconstruction accuracy and the triangles show the estimation accuracies expected by chance.
(B) Estimation accuracies computed across monkeys (V1 data, spontaneous activity). Entry in row i, column j indicates the estimation accuracy obtained when the W-K filter was computed using all the electrodes recorded in monkey i and the estimation accuracy was computed using the spike trains and LFPs from monkey j. Note that the LFP estimate for a given electrode is always computed here using the spike train from the same electrode (using Eq. 2). The W-K filter is computed using data from a different monkey (using Eq. 8). The values reported correspond to the average across all electrodes in monkey j. We indicate the estimation accuracies for the diagonal entries for reference. The bottom part shows the W-K filters for each monkey.

